GPM

Content which is affiliated solely with the Global Precipitation Measurement Mission.

A Tale of Two Extremes: Rainfall Across the US
The United States has seen a tale of two extremes this year, with drenching rains in the eastern half of the country and persistent drought in the west. A new visualization of rainfall data collected from space shows the stark contrast between east and west for the first half of 2015. The accumulated precipitation product visualized here begins on Jan. 1, 2015, and runs through July 16, 2015. This visualization shows the heavy rainfall throughout Northern Texas and across Oklahoma as well as the drought in Southern California. Credits: NASA Goddard's Scientific Visualization Studio Download...

Hurricane Guillermo Heads Toward Hawaii

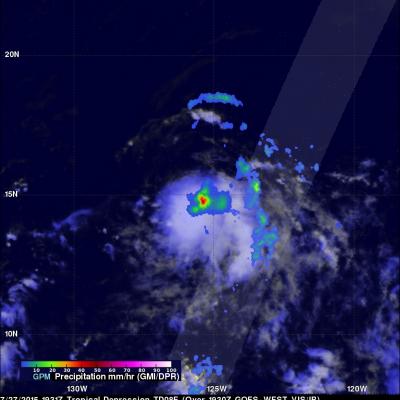
On July 29, 2015 tropical depression Nine-E formed in the eastern Pacific Ocean well southwest of the southern tip of Baja California. The tropical depression was in an area of warm ocean water which helped the tropical cyclone blossom into tropical storm Guillermo early on July 30, 2015. Guillermo is a hurricane today and is headed over the open waters of the Pacific Ocean toward the west-northwest. In about a week Guillermo may affect the Hawaiian Islands as a tropical storm. On July 31, 2015 at 0556 UTC Guillermo was about 319 km (~590 Nautical Miles) east-southeast of Hilo, Hawaii when the
California “Rain Debt” Equal to Average Full Year of Precipitation
California's accumulated precipitation “deficit” from 2012 to 2014 shown as a percent change from the 17-year average based on TRMM multi-satellite observations. Credits: NASA/Goddard Scientific Visualization Studio A new NASA study has concluded California accumulated a debt of about 20 inches of precipitation between 2012 and 2015 -- the average amount expected to fall in the state in a single year. The deficit was driven primarily by a lack of air currents moving inland from the Pacific Ocean that are rich in water vapor. In an average year, 20 to 50 percent of California's precipitation...

GPM Sees Tropical Cyclone Drenching Bangladesh

Bangladesh was already soaked by monsoon rainfall before recently formed tropical storm Komen started drenching the area. The GPM core observatory satellite collected data above the tropical cyclone on on July 30, 2015 at 0436 UTC ( 10:36 AM BDT). GPM's Microwave Imager (GMI) measured rain falling at the extreme rate of close to 150 mm (5.9 inches) per hour in powerful storms over the Bay Of Bengal. A 3-D view of thunderstorm tops based on radar reflectivity day from GPM's Dual-Frequency Precipitation Radar (DPR) is shown here. DPR (Ku band) radar data were used in this simulated cross section

PPS Data Outage

Effective about 18 UTC July 21 the GPM MOC stopped sending data to the PPS. This was not a satellite or instrument issue. The problem appeared to be a network connection issue at the Emergency MOC which is currently receiving data as part of a monthly test of the backup facility. Effective 21:41 UTC the data flow from the MOC to PPS resumed. Apparently there was a major network issue on that part of the network. It has now been fixed and MOC is sending data again.

Delay in Some GMI and Combined

Starting at 16:33 UTC July 6 a filled log directory led to sh commands failing on redirecting logs to be created in that directory. A typo in the cleanup routine failed to clean our all the files after the normal 4 days. As a result they have been accumulating since the beginning of the mission. It is unexpected that the sh failed when it could not redirect anymore. All data products that failed have been created and put in the appropriate directories. However, this will mean a failure in the data latency requirements for some of the GMI L1B and GPROF and a few combined products.

TD08E Formation Monitored By GPM

The GPM core observatory satellite flew over forming tropical depression 08E on July 27, 2015 at 1931 UTC ( 12:31 PM PDT). Rainfall was measured by GPM's Microwave Imager (GMI) and Dual-Frequency Precipitation Radar (DPR) falling at a rate of 50 mm (almost 2 inches) per hour in storms near the center of the tropical depression. The National Hurricane Center (NHC) predicts that TD08E will not intensify very much because northwesterly vertical wind shear is retarding development. GPM's DPR instrument scan (shown in lighter shades) viewed an area east of the center of the developing tropical

Typhoon Halola Threatening Japan

Typhoon Halola is predicted by the Joint Typhoon Warning Center (JTWC) to weaken to tropical storm intensity over the next couple days while passing to the north of Okinawa, Japan. Recent predictions of Halola's track are shown overlaid in red. The GPM core observatory's Microwave Imager (GMI) and Dual-Frequency Precipitation Radar (DPR) measured rainfall as it flew directly over typhoon Halola in the western Pacific Ocean on July 23, 2015 at 1414 UTC. A simulated 3-D flyby around typhoon Halola was made from GPM Radar data (Ku Band). This animation shows that that Halola's eye wall was

GPM Sees Halola Becoming A Typhoon

Satellite technology has the ability to see things we could never imagine, like how hard the rain is falling in storms, and how high cloud tops stretch into the atmosphere. The Global Precipitation Measurement (GPM) core observatory satellite does both of those things and has been providing that information each time it passes over Typhoon Halola in the Northwestern Pacific Ocean. The GPM core observatory is a joint effort between NASA and the Japan Aerospace Exploration Agency. GPM saw Halola when it was strengthening from a tropical storm into a typhoon. GPM flew over Tropical Storm Halola