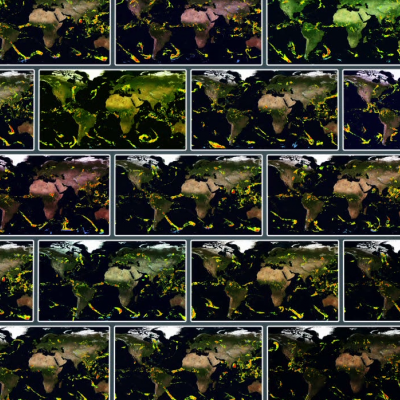
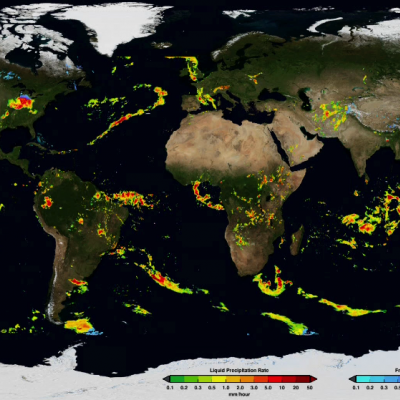
Amazon Precipitation (IMERG)
Animation of precipitation rates over the Amazon Rain Forest as it pulsates with the diurnal cycle. Notice how during the day precipitation amounts increase and then decrease nightly.
Content which is affiliated solely with the Global Precipitation Measurement Mission.
Animation of precipitation rates over the Amazon Rain Forest as it pulsates with the diurnal cycle. Notice how during the day precipitation amounts increase and then decrease nightly.
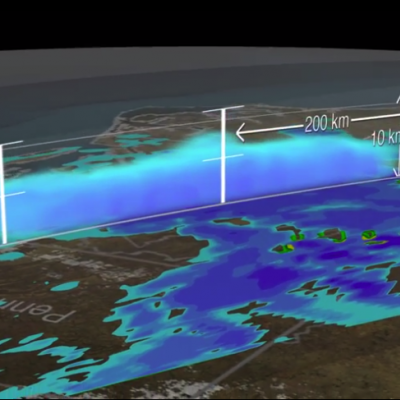
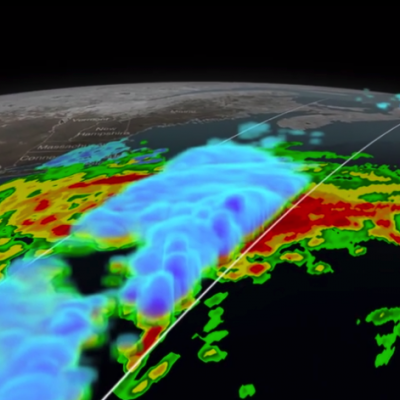
At 5:05 p.m. EST Monday, Jan. 26, 2015, the Global Precipitation Measurement mission's Core Observatory flew over the Nor'easter that dumped snow on New England. This satellite image shows the rate of rainfall, with low amounts in green and high in red, and snowfall, in blue to purple. The center of the storm, shown in 3-D, was offshore with far reaching bands of snowfall. More intense snow rates are shown in darker blue, which can be seen on the northern edge of the storm.