
Hurricane Rina Threatens the Yucatan
After a two-week period without any storms, the 2011 Atlantic hurricane season has picked up with the arrival of Hurricane Rina. Rina began as a tropical depression on October 23rd in the western Caribbean. Like many storms that form later in the season, Rina's formation was influenced by a midlatitude front that had penetrated deeper into the Tropics over warm water. These fronts can provide a focus for showers and thunderstorms that can eventually evolve into a tropical cyclone. During the peak of hurricane season in late August and September, a lot of storms form out over the central tropical Atlantic from waves moving off of the coast of Africa; Hurricane Philippe, the last storm prior to Rina, originated in this area at the end of September. By mid October, the focus tends to shift to the western Caribbean as is the case with Rina. After forming about 100 miles (~160 km) northeast of the border between Honduras and Nicaragua, Rina intensified over the warm waters of the western Caribbean as it tracked slowly westward toward Belize, becoming a minimal Category 1 hurricane on the 24th and a Category 2 storm on the 25th. Early the next morning on the 26th, Rina was a little stronger but still a Category 2 storm on the Saffir-Simpson hurricane intensity scale and was located about 200 miles (~330 km) east of Belize, when the TRMM satellite flew over the storm.

The Tropical Rainfall Measuring Mission (or TRMM) satellite was launched back in November of 1997 with the primary mission of measuring rainfall from space using a combination of both passive microwave and active radar sensors. TRMM has also proven to be a valuable platform for observing tropical cyclones. TRMM collected this first image of Rina at 8:06 UTC (3:06 am CDT) on 26 October 2011. The first image shows a top-down view of the rain intensities within Rina. Rain rates in the center of the swath are from the higher resolution TRMM Precipitation Radar (PR), while those in the outer swath are from the TRMM Microwave Imager (TMI). The rainrates are overlaid on visible and infrared (IR) data from the TRMM Visible Infrared Scanner (VIRS). TRMM shows an area of intense rain (darker red area) just north of the center of the storm that makes up the northern eye wall. To the south of the center the eyewall is mostly absent with very little rain. In fact outside of the northern eyewall, most of the rain is contained in a couple of rainbands far away from the center (scattered blue and green areas indicating, light and moderate rain, respectively).
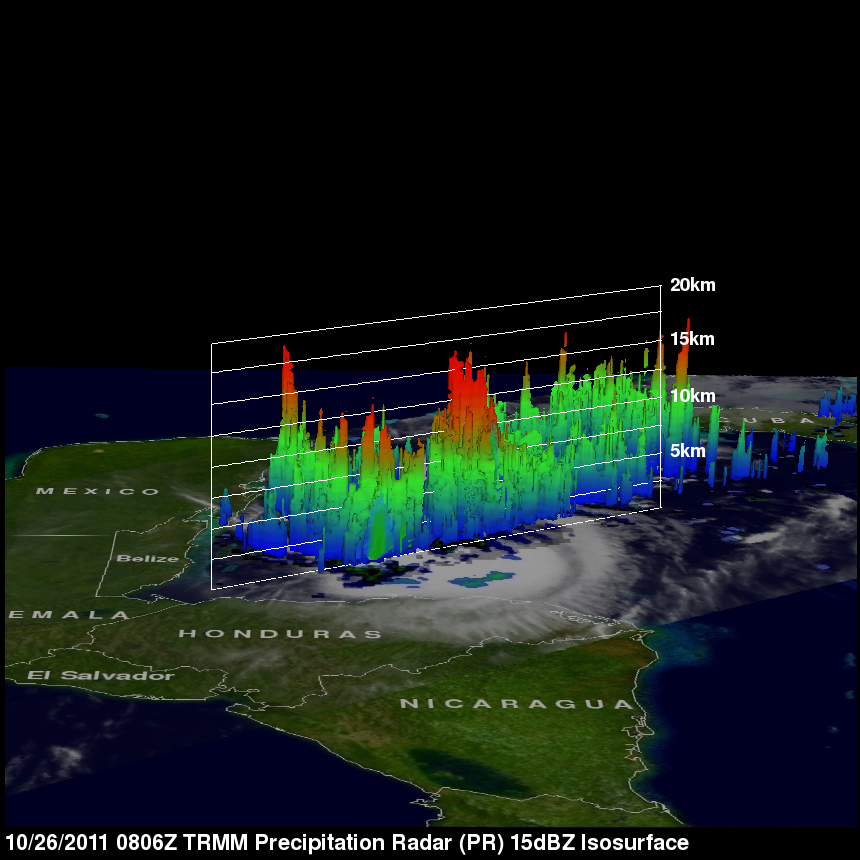
The next image was taken at the same time and shows a 3D view of Rina. The areas shown in red are the tops of deep convective towers where precipitation-sized particles have been carried aloft by stronger updrafts within thunderstorms. TRMM shows several towers both near the center and in the outer rainbands with tops over 15 km (brighter red areas). The heat released within these updrafts, mainly from condensation, is what drives tropical cyclones, including their intensity. At this stage, Rina seems poised to intensify. Immediately after these images were taken, Rina's central pressure fell slightly, but after that the storm weakened. Rina's small size means it can quickly become vulnerable to changing environmental conditions. At the time of these images, Rina was a Category 2 storm with sustained winds reported at 95 knots (~110 mph). Later in the day, Rina was downgraded to a Category 1 storm with maximum sustained winds of 85 mph. Rina is expected to pass over the northeast tip of the Yucatan Peninsula before turning east.
Click here to see a 3D flyby of Rina courtesy of the TRMM PR