
The 1-2 Punch: Hurricanes Marco and Laura and the US Gulf Coast
Update on August 28, 2020:
During its approach to Louisiana, Hurricane Laura dramatically intensified from Category 2 to 4 (105 mph to 150 mph) between at 1AM and 7PM Central Time (CDT) on August 26, 2020. In the updated movie below, the precipitation falling from Laura is shown through 10:30PM CDT, August 27, as estimated by NASA's IMERG algorithm.
To open the animation in a separate window, click here.
On August 26, Laura became the first North Atlantic hurricane to reach "major hurricane" status this year, meaning that it reached category 3 on the Saffir-Simpson hurricane-intensity scale. Laura followed on the heels of Hurricane Marco, which was a much weaker system with only minor impacts on the US Gulf Coast.
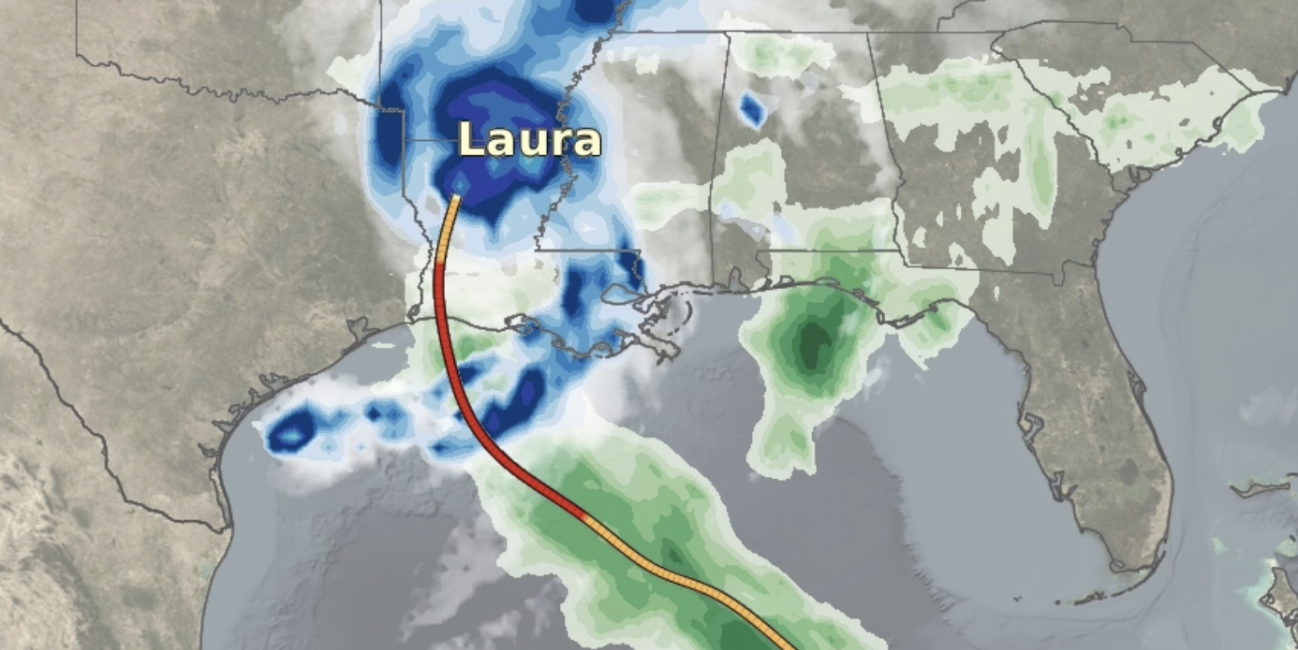
In this animation, blue and yellow shading show precipitation rates from NASA's IMERG algorithm, which estimates precipitation in near-realtime at half-hourly intervals based on a constellation of satellites. Green shading shows the rainfall accumulation starting from the beginning of the movie. The multi-colored line shows Laura's track and intensity based on advisories posted by the National Hurricane Center, smoothed for the animation, while the gray/white shading shows infrared observations from NOAA geosynchronous satellites, indicating cloudiness.
The IMERG algorithm estimated that Hurricane Laura dumped over 6 inches over parts of Louisiana and over 10 inches in some patches of the Gulf of Mexico (dark green in the animation). Coastal Louisiana experienced storm surge, strong winds, flash flooding, and hurricane-spawned tornadoes. Credits: Visualization and caption by Jason West (NASA/PPS).
Status on August 25, 2020:
NASA tracked hurricanes Marco and Laura as they approached the US Gulf Coast in late August 2020. On August 22, Marco reached tropical-storm strength and the next day entered the Gulf of Mexico. Marco briefly reached hurricane strength before the rainstorms associated with it passed over the US Southeast on August 25.
To open the animation in a separate window, click here.
As can be seen in the above animation, NASA combined data from multiple satellites to estimate the rainfall from Marco and Laura in near-realtime at half-hourly intervals. In the animation, shades of blue and yellow display the 3-hour-average rainfall rate from NASA's IMERG algorithm. The storm-total accumulation since 0000 UTC on August 21 is shown in shades of green. Shades of gray and white indicate clouds, based on NOAA infrared geosynchronous satellite data. The National Hurricane Center storm tracks are shown in yellow for tropical depressions and storms, smoothed in time for the animation. Where a storm is hurricane strength, the track is colored orange.
By August 25, 2020, parts of the Florida Panhandle had seen over 15 centimeters (~6 inches) of rain during Marco's passage, including from a brief period late on August 23 when it had intensified to a Category 1 hurricane. However, the storm had already begun to rapidly weaken on August 24. Battling high wind shear, the precipitation region moved eastward on August 25 while the center of rotation moved westward.
Meanwhile, Texas and Louisiana residents were warned of possible impacts from tropical storm Laura, which tracked steadily westward throughout the period of the movie, strengthening to hurricane status on August 25. Credits: Visualization and caption by Jason West (NASA/PPS).