Two Decades of Precipitation Measurement
NASA’s Precipitation Measurement Missions (PMM) have collected rain and snowfall from space for nearly 20 years, and for the first time in 2019, scientists can access PMM’s entire record as one data set.
PMM includes two missions – the Tropical Rainfall Measuring Mission (TRMM), which orbited Earth from 1997 to 2015, and its successor, the joint NASA-JAXA Global Precipitation Measurement mission (GPM), which has been collecting data since 2014. This year, however, the GPM project upgraded its data algorithms to calibrate and incorporate TRMM data into its release, giving researchers, modelers and meteorologists access to the entire 19-year record.
By being able to compare and contrast past and present data, researchers are better informed to make climate and weather models more accurate, better understand normal and extreme rain and snowfall around the world, and strengthen applications for current and future disasters, disease, resource management, energy production and food security.
Watching Precipitation to Improve the World
GPM provides a four-dimensional view of rain, snow, sleet and storms from space: It not only records the size of droplets or pellets, but how heavy the precipitation is and how it changes over time. This perspective is used not only for global science, like studying Earth’s water and energy cycles and spotting extreme weather around the world, but it is also useful for studying single events, like hurricanes or droughts.
GPM’s signature algorithm is the Integrated Multi-satellitE Retrievals for GPM, or IMERG. IMERG calibrates and combines data from its main satellite, the GPM Core Observatory, and the GPM Constellation, a group of international satellites that contribute data to GPM while also performing their own missions. While the full IMERG product takes time to process and prepare, it also generates a near-real-time summary of global precipitation every half-hour, which is useful for time-sensitive applications like weather forecasting and disaster recovery.
Researchers, emergency responders, health professionals and resource managers use IMERG data to see how precipitation shaped events in the past, to help them prepare for similar events in the future. By creating a reliable, multiple-decade baseline of rain and snow, IMERG shows how precipitation may deviate from normal, informing models that predict crop yields, disease outbreaks and landslides.
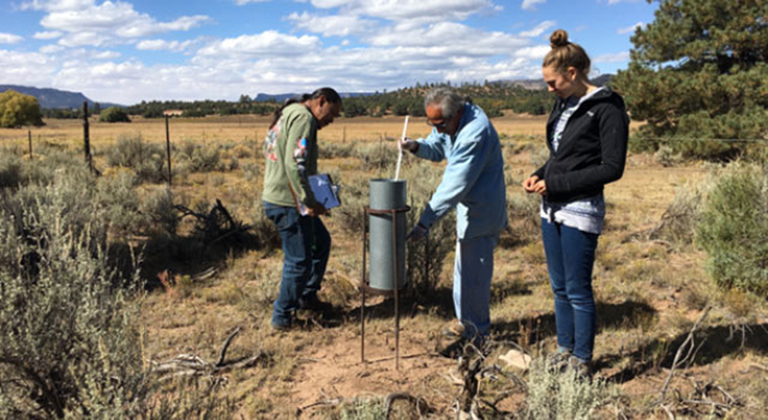
IMERG data also supports applications like water resource management, said Andrea Portier, GPM’s applications coordinator. For example, in the Navajo nation, located in the southwestern United States, precipitation data are critical for water resource managers supervising scarce water for farming, drinking and caring for animals. GPM rainfall measurements and maps help them know what areas are at risk of drought.
Eyeing the Past to Predict the Future
Studying IMERG data from a longer perspective gives scientists a different view: What regions received the most or least rainfall, where did the biggest storms strike, how does precipitation change across the seasons?
“For the last five years, with GPM, we’ve had a multi-satellite precision data set that covers practically the whole world,” said George Huffman, IMERG’s lead scientist and GPM’s deputy project scientist. “But five years is a short time. We needed to have something longer … extending the multi-satellite record over the entire two missions gives us a chance to get long-term statistics and analyze past conditions.”
One important application for past precipitation data is in weather and climate modeling, the foundation for studying short-term weather and long-term climate regionally and globally. Scientists use sophisticated computer programs to analyze large quantities of observed data on air temperature, atmospheric pressure, wind, precipitation, soil moisture and many other variables. These computer programs then generate forecasts for short-term weather or long-term climate.
“We need the past to model the future. The past gives us the baseline we need to understand future events,” said Dalia Kirschbaum, GPM’s deputy project scientist for applications. “For example, in the case of extreme weather, like hurricanes, we can better understand what ‘extreme’ means if we have a baseline for comparison. This update is a milestone by supporting more accurate precipitation estimates that can be used as ‘ground truth’ in working toward more accurate future predictions.”
Another set of processes the team hopes to understand more completely are changes in precipitation from day to night and across seasons.
“One of the important things we’re looking for is understanding how the Earth system works,” Huffman said. “GPM gives us information about what the environment is doing and enables us to look at how rainfall may interact with other Earth system variables, such as soil moisture, air quality and vegetation.”
 On the Navajo nation, located in the southwestern United States, precipitation data is critical for water resource managers supe
On the Navajo nation, located in the southwestern United States, precipitation data is critical for water resource managers supervising scarce water for farming, drinking and caring for animals. GPM rainfall measurements and maps help them know what areas are at risk of drought and in need of additional care.
Credits: NASA / Amber McCullum
By looking back to see where rain and snow fell in the past 19 years, scientists can help people around the world prepare for the future, from localized short-term drizzles to large-scale, decadal patterns.
Data from both GPM and TRMM are free and available to the public. The PMM website lists the access points for various datasets and provides tutorials and webinars on how to download and use them. The tutorials range from basic data access and use to specific applications, such as flood management, agriculture, and disease monitoring and response. IMERG will continue providing data for the life of the GPM mission, expected to last to the mid-2030’s or beyond.

