
OLYMPEX Field Campaign
The Olympic Mountain Experiment (OLYMPEX)
![]()
The Olympic Mountain Experiment, or OLYMPEX, was a NASA-led field campaign, which took place on the Olympic Peninsula of Washington State from November 2015 through February 2016. The goal of the campaign was to collect detailed atmospheric measurements that will be used to evaluate how well rain-observing satellites measure rainfall and snowfall from space. In particular, OLYMPEX assessed satellite measurements made by the Global Precipitation Measurement (GPM) mission Core Observatory, a joint mission by NASA and the Japan Aerospace Exploration Agency (JAXA), which launched in 2014.
What is Ground Validation?
The GPM Core Observatory and other rain-observing satellites orbit Earth hundreds of miles above the ground. From that altitude, they have a clear view of clouds and storms over nearly 90 percent of Earth (the angle of the orbit means the GPM Core Observatory misses the poles). But in order to ensure that the satellite measurements of rainfall and snowfall are accurate from space, scientists make measurements from ground-based stations as storms pass over, while aircraft fly overhead with instruments that simulate the satellites' instruments. This lets them accurately compare the best estimate of truth on the ground to the view of precipitation from above.
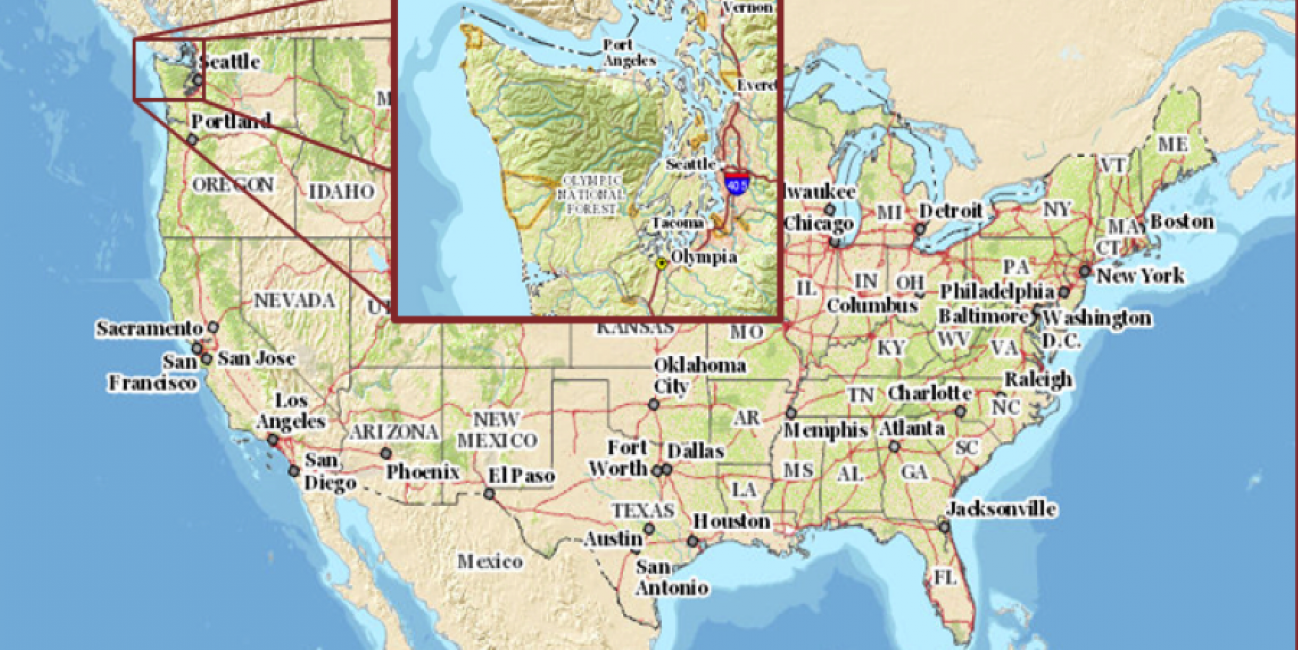
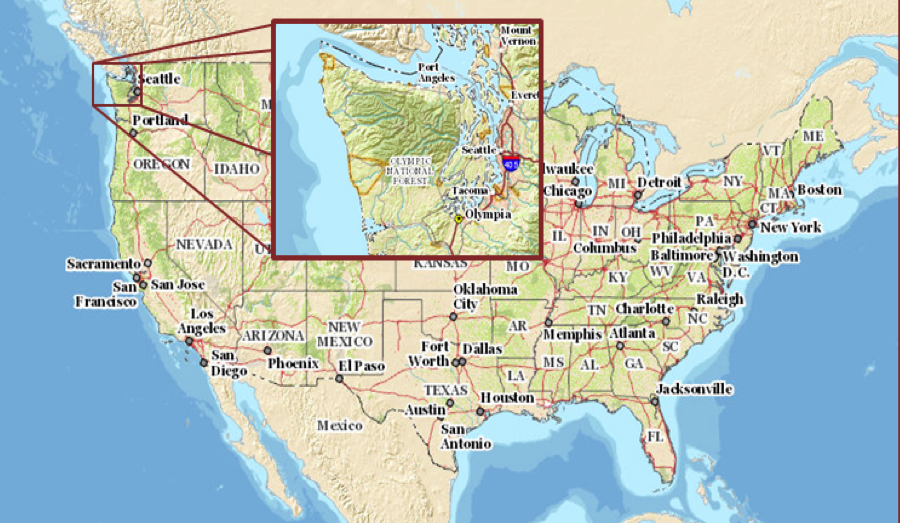 Map modified from: http://viewer.nationalmap.gov/viewer/
The Olympic Peninsula is an ideal location to conduct a ground validation field campaign. Situated in the northwest corner of Washington State, the peninsula is home of the only temperate rain forest in the Northern Hemisphere. Its active winter storm season consists of wet weather systems traveling from the Pacific Ocean, over the coastal region and into the Olympic Mountains. The peninsula reliably receives annual precipitation amounts ranging from over 100 inches (2500 mm) on the coast to about 180 inches (4500 mm) in the forested mountainous interior.
Teams of scientists set up ground instruments including rain gauges, advanced weather radars, and balloon launching sites to monitor incoming storms. Simultaneously, they collected data from three aircraft that flew through and above rain clouds, as well as from the GPM Core Observatory and other rain-observing partner satellites as they passed overhead.
Scientists then used the detailed data sets to improve their understanding of the processes in the atmosphere that cause precipitation and to improve the computer programs that interpret satellite measurements of rainfall and snowfall from space.
Science Questions
For storm systems in the mid-latitudes between the tropics and the poles, how does precipitation behave in different sections of the system?
Large weather systems arrive in the Pacific Northwest from the ocean, and not all parts of the system are equal. The leading edge, called the pre-frontal sector, tends to be warmer and have steady rainfall. Next, the frontal sector marks the transition from the warmer air to the colder air and processes that produce rainfall are often most intense in this region.. Finally the post-frontal sector, characterized by colder temperatures, will often bring showery rain and snow, and can produce large snowfall accumulations at higher elevations. The field campaign looked inside these storm clouds with ground radar and aircraft instruments to determine the accuracy of the GPM satellite constellation in detecting the unique precipitation characteristics in these different storm sectors.
How does precipitation in clouds over the Pacific Ocean differ from precipitation over the ocean, coastline and Mountains?
Ground radars located on the coast were scanning storm systems as they approached from the Pacific Ocean. The relatively flat surface of the ocean provides ample moisture and no resistance as storms travel eastward toward land. Over the coast, the presence of land changes how the air moves. Uneven ground and especially the mountains act like rocks in a stream that force the air up and around. The modification of the airflow associated within the storm system by the presence of the mountains affects how raindrops, ice particles or snowflakes behave inside clouds.
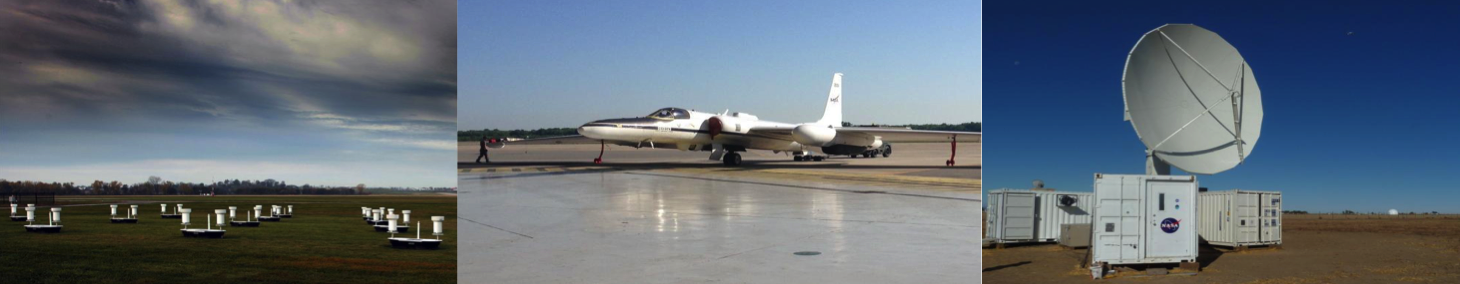 Left: Rain gauges and soil moisture sensors deployed in Iowa during IFloodS. Credit: Iowa Flood Center Middle: NASA’s ER-2 aircraft ready to deploy during IPHEx in North Carolina. Credit: NASA Right: NASA’s NPOL radar, one of two fully transportable research-grade S-band radars in the world. Credit: NASA
Inside clouds what is the mixture of liquid rain versus solid ice particles and snow and how does that affect how much it will rain or snow?
One of the aircraft flew through the clouds to make detailed measurements of raindrops, ice particles, and snowflakes as they fell to Earth’s surface. Combined with data from the ground radars and the total amounts caught by the rain gauges and other instruments on the ground, scientists will be able to improve the computer models of precipitating clouds – the same types of computer models used to forecast the weather and project future climate.
What happens when the precipitation reaches the ground and runs into rivers and streams?
A lot of rain means a lot of water flowing over the landscape – and sometimes overflowing it. Scientists are using data from the ground instruments as well as monitors on local streams and rivers to assess where the water goes once it's on the ground. They are also improving tools for flood prediction by using computer models to evaluate the potential for flooding in nearby communities.
How far can satellites "zoom in" to accurately distinguish precipitation types and intensity?
Rainfall and snowfall are highly variable over very small areas – it might be raining in your backyard but not across the street. But from space, satellites necessarily have to summarize what is happening over a larger area. The field campaign's detailed ground measurements paired with instruments on aircraft that simulate satellite observations are helping scientists figure out how small they can accurately make that footprint of rain estimates.
Field Locations
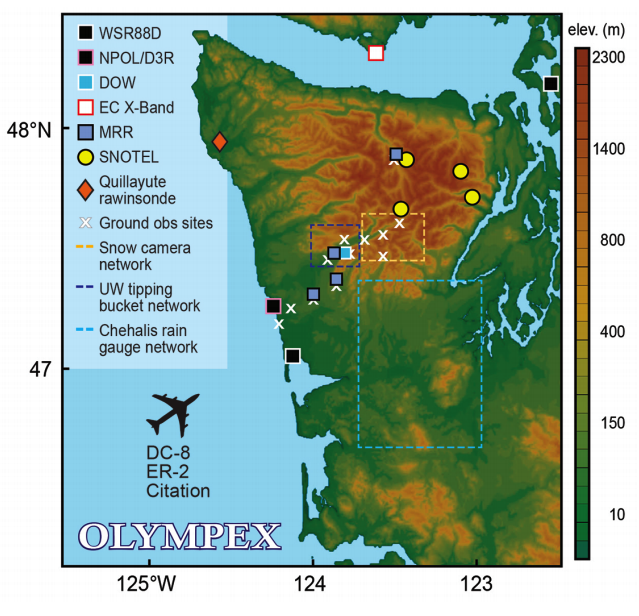 Map of ground observations for OLYMPEX. Radars shown as squares, SNOTEL sites as circles, key ground observing locations as X’s and rain and snow networks as dashed boxes.
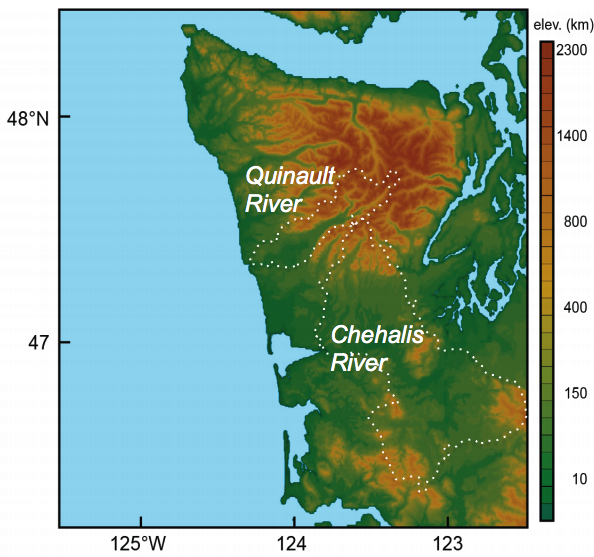 Map showing the location of the two river basins, the Quinault and the Chehalis, which will be the focus for hydrology for OLYMPEX.
OLYMPEX Scientists in the Field
Rachael Kroodsma is the instrument scientist for the CoSMIR on board NASA's DC-8 airborne laboratory as part of the OLYMPEX field campaign.
This video is public domain and can be downloaded at: http://svs.gsfc.nasa.gov/goto?12091
Joe Zagrodnik is a student at the University of Washington who is working with NASA scientists to measure the properties of rain and snow in the Olympic National Park.
Photo credits: Mark Harris, Joe Zagrodnik, and Bill Baccus
This video is public domain and can be downloaded at:
http://svs.gsfc.nasa.gov/cgi-bin/deta...