
Nimisha Wagle - Mapping the Drainage Pattern of Canadian Shield (Baker Creek) with Realistic Rainfall Data
Overview: The Canadian Shield Region (CSR) is the Precambrian rock-dominated, deglaciated region of Northern America. There are more lakes than anywhere else in the world. As projected climate change intensifies the water and energy cycles, understanding fundamental hydrologic changes in these environments will be critical for predicting and managing water resources. In this study, I am using IMERG to find the potential sensitivity of Canadian shield depressions to inundation depth.
Mentor: Chuntao Liu
2022 GPM Mentorship Program
Nimisha Wagle - Mapping the Drainage Pattern of Canadian Shield (Baker Creek) with Realistic Rainfall Data
Participant Name: Nimisha Wagle
Project: Mapping the Drainage Pattern of Canadian Shield (Baker Creek) with Realistic Rainfall Data
Affiliation: Brown University, USA
Current role: PhD Student
Mentor: Chuntao Liu
Download Project Overview Highlights (.pptx)
Download Final Presentation (.pdf)
Why are you participating in this program?
I participated in this program to learn about satellite precipitation data and how to use this data in my research.
Tell us about your project
The Canadian Shield Region (CSR) is the Precambrian rock-dominated, deglaciated region of Northern America. There are more lakes than anywhere else in the world. As projected climate change intensifies the water and energy cycles, understanding fundamental hydrologic changes in these environments will be critical for predicting and managing water resources. The CS surface drainage pattern is poorly mapped at present. A study on how different inundation depth caused by rainfall changes the drainage pattern has not been done. In this study, I am finding the potential sensitivity of Canadian shield depressions to the inundation depth.
Specifically for this project, I am analyzing rainfall data derived from GPM’s IMERG product and high-resolution digital elevation models (DEMs) from ArticDEM over 50 hours to find the inundation depth of the Baker Creek region in the northern part of the Canadian shield area. I then used this information to map newly formed drainage patterns. For this, I delineated depressions by filling ArcticDEM and subtracted them from the original ArcticDEM. Next, the surface drainage pattern was mapped by quantifying the sensitivity of depression storage to inundation depth and developing a relationship between depth and volume for each depression in the landscape. Upon filling depression storage any additional water is routed downslope using a least-cost path algorithm.
From my study, we can see that 45% of the total depression storage is filled due to realistic rainfall for 50 hours. We can see that many new streams are formed. But these streams are stable. 900 new streams are formed interconnecting the depression storage.
The new streams are forming the dendritic pattern. My study concludes that Canadian Shield surface water depression storage and hydrological connectivity are susceptible to rainfall events. Understanding these changes will be critical in predicting and managing water resources. This work is ongoing. In the future, I will use rainfall data and climate models to find the potential sensitivity of the depression storage to the regional water balance.
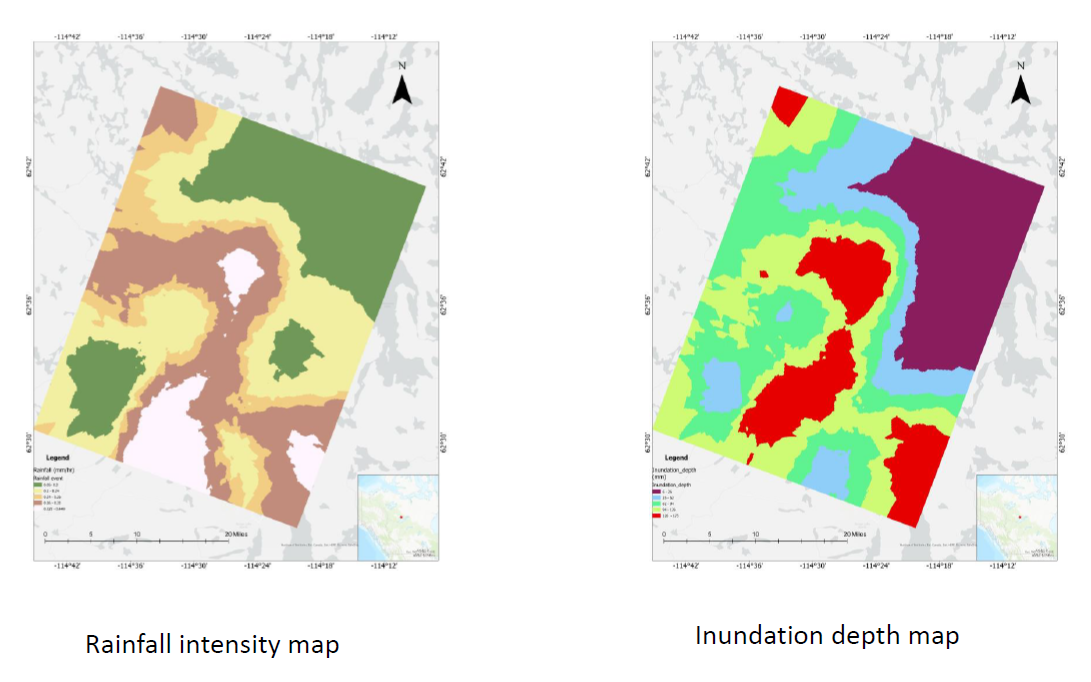
GPM IMERG data along with DEMs were used to help calculate inundation depth. Understanding fundamental hydrologic changes after rainfall events will be critical for predicting and managing water resources. Credits: N Wagle
What communities or organizations may benefit from your case study project?
The work which I am doing is very helpful for city planners and government for predicting and managing water resources.
What is something surprising that you have learned about the GPM mission, the data, or applying GPM data for applications?
The results obtained are surprising, I can see that the drainage patterns and depression storage are highly sensitive to rainfall events.
What is a challenge you faced with using remote sensing data? Any lessons learned that helped overcome this barrier?
Many parts of the Canadian Shield are in very remote locations and therefore, are very difficult to travel to and conduct field experiments. So, remote sensing is very helpful to carryout my project study in those parts without physically being present there.
How do you plan to use GPM in the future?
I will continue my work and use GPM data for more research.