
NASA Helps the World Weather the 2020 Hurricane Season
Forecasters predicted an above-normal hurricane season for 2020. They weren’t wrong.
As the 2020 Atlantic hurricane season smashed records with an unprecedented 30 named storms, NASA’s Earth Applied Sciences Disasters Program stood up to the challenge. The Disasters Program helps leaders and responders at national, regional, and local levels leverage NASA’s technology and expertise to assess, predict, and understand disasters' impacts. The Disasters Program targets a wide range of hazards and disasters, and while NASA is not an operational response agency, the agency offers access to unique resources, relationships, and scientific expertise to those who use it on the ground.
The Atlantic hurricane season, which officially ran from June 1 to Nov. 30, marked the fifth year in a row with above-average hurricane activity. The National Weather Service noted that every mile of the U.S. Atlantic coast was under a tropical watch or warning in 2020. NOAA reported the most billion-dollar disasters in the U.S. in a single year in the 40 years that they have kept track, which hurricanes contributed significantly to. Of twelve named storm systems that made landfall in the continental U.S. in 2020, seven (Hanna, Isaias, Laura, Sally, Delta, Zeta and Eta) each caused over $1 billion in overall damage costs.
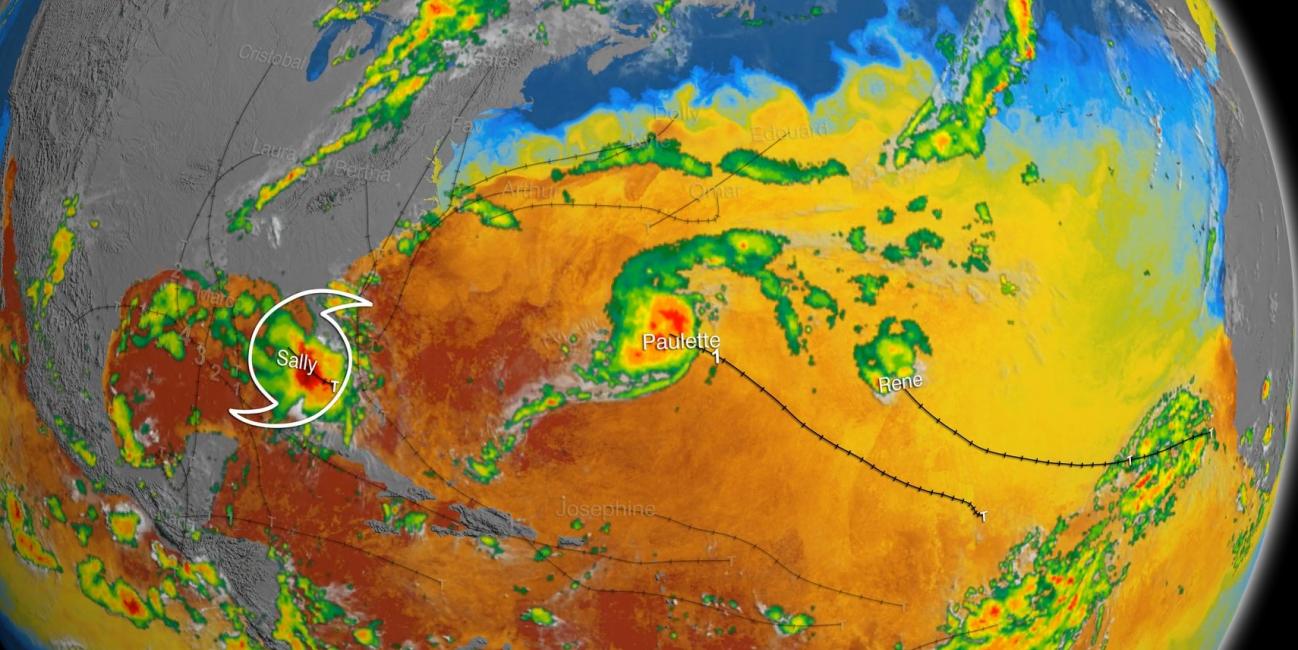
This visualization shows the hurricanes and tropical storms of 2020 as seen by NASA’s Integrated Multi-satellitE Retrievals for GPM (IMERG) - a data product combining precipitation observations from infrared and microwave satellite sensors united by the GPM Core Observatory. IMERG rain rates (in mm/hr) are overlaid on infrared cloud data from the NOAA Climate Prediction Center (CPC) Cloud Composite dataset together with storm tracks from the NOAA National Hurricane Center (NHC) Automated Tropical Cyclone Forecasting (ATCF) model. Sea surface temperatures (SST) are also shown over the oceans, derived from the NASA Multi-sensor Ultra-high Resolution (MUR) dataset, which combines data from multiple geostationary and orbiting satellites. Sea surface temperatures play an important role in hurricane formation and development, with warmer temperatures linked to more intense storms. Credits: NASA Goddard Scientific Visualization Studio
Tropical storms and hurricanes were also more active and intense later in the year than usual. “Countries that experience hurricanes are used to that season peaking between July to September,” remarks Ronan Lucey, a researcher at the University of Alabama in Huntsville, working within NASA’s Disasters Program. “This was a long season, and we have to look at the climatic conditions that lead to that.”
Looking Out for Louisiana
The southern coast of the U.S. certainly saw its share of storms. Late October marked the fifth time a named tropical storm or hurricane made landfall in Louisiana in 2020, as Hurricane Zeta followed Hurricanes Delta and Laura and Tropical Storms Marco and Cristobal to deluge the state. Hurricane Sally also headed for Louisiana before tracking northeast to make landfall nearby at Gulf Shores, Alabama. Laura, a Category 4 hurricane, was the strongest storm in the series, causing an estimated $19 billion in damage along the coast and inland to the city of Lake Charles. Six weeks later, Hurricane Delta struck as a Category 2 hurricane – just 15 miles from where Laura made landfall.
For Hurricanes Laura, Sally, and Delta, the Disasters Program activated to collaborate closely with stakeholders from the Federal Emergency Management Agency (FEMA), the Louisiana National Guard, and the Alabama Emergency Management Agency, among others. NASA Disaster coordinators provided guidance and shared expert analysis in meetings and through data distributed on the NASA Disasters Mapping Portal.
Continue reading the full story on appliedsciences.nasa.gov: NASA Helps the World Weather the 2020 Hurricane Season