
Using GPM Data to Understand Hurricanes
The 2019 Atlantic "hurricane season" is officially upon us and runs through November 30th. Did you know that GPM data play a fundamental role in the ability to monitor existing storm activity such as capturing the location and intensity of rainfall inside a storm, as well as improving weather and precipitation forecasts through assimilation of instantaneous precipitation information? Here are a few applications of GPM data used to study hurricanes and how the data was then used for decision-making.
Monitoring Irma with GPM
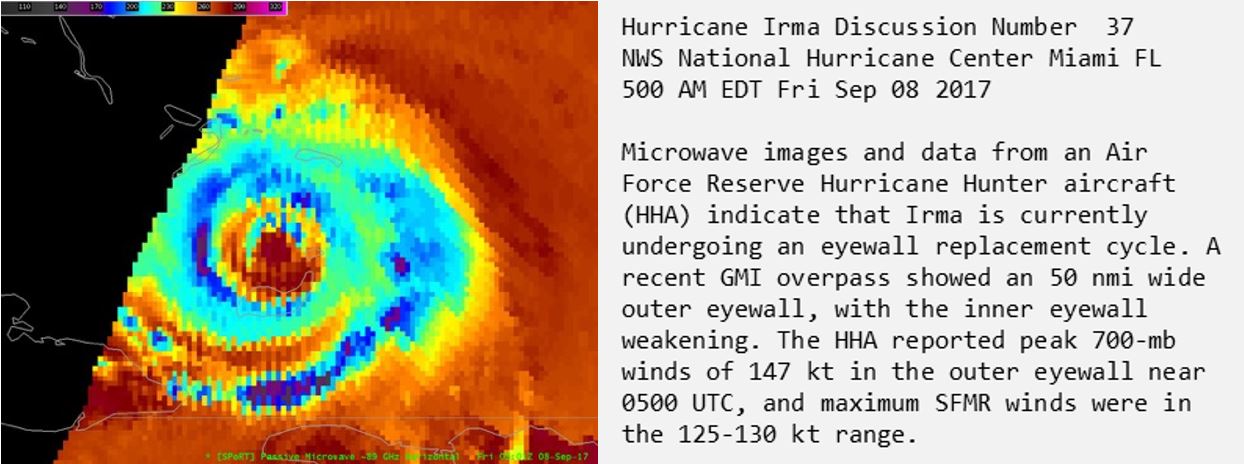 This image shows rainfall analysis that was derived from GPM's GMI data on Sept. 8 as Irma moved north of Cuba.
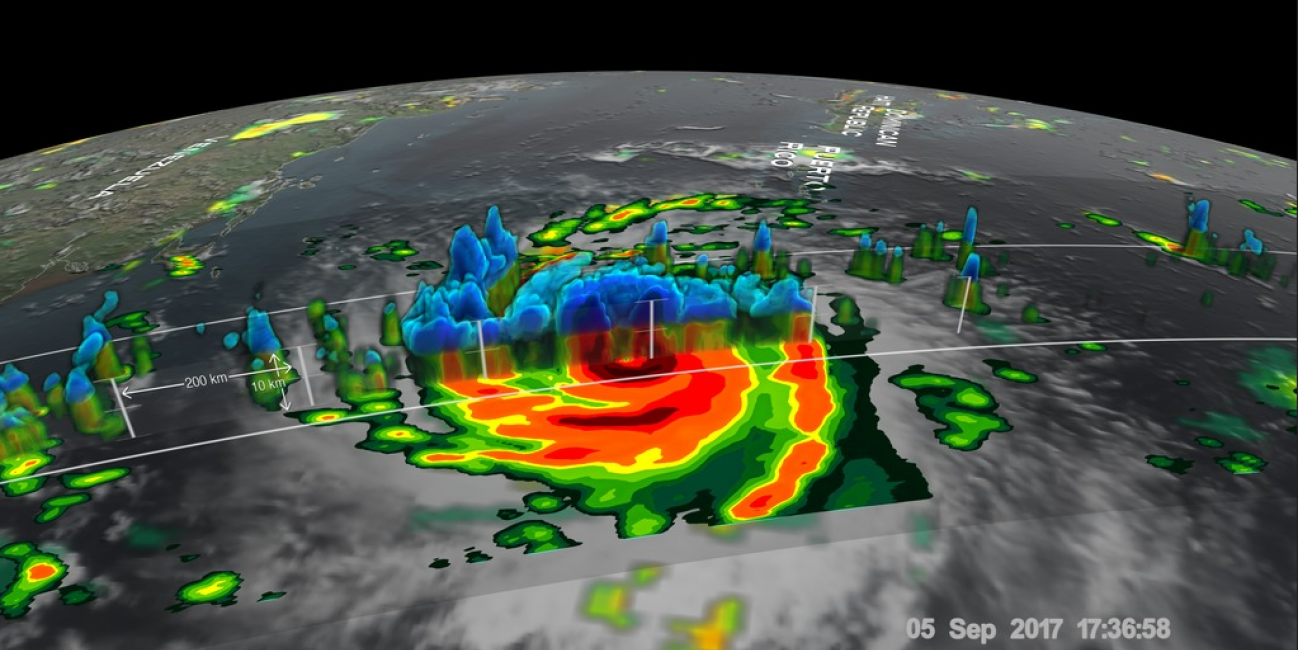
Hurricane Irma was the strongest Atlantic basin hurricane ever recorded outside the Gulf of Mexico and the Caribbean Sea. NASA GPM's Microwave Imager (GMI) and Dual-Frequency Precipitation Radar (DPR) instruments were used to help understand the locations and intensity of heavy precipitation within Irma. Specifically, imagery from GMI was provided to NOAA’s National Hurricane Center through NASA’s Short-term Prediction Research and Transition (SPoRT) Center to understand the state of Irma on September 8, 2017 as it moved north of Cuba. GMI observations documented an eyewall replacement cycle, which impacts the intensity and development of the storm. The 3D view of Irma from September 5th revealed powerful storms in Irma’s eyewall with estimates rates of 10.8 inches per hour.
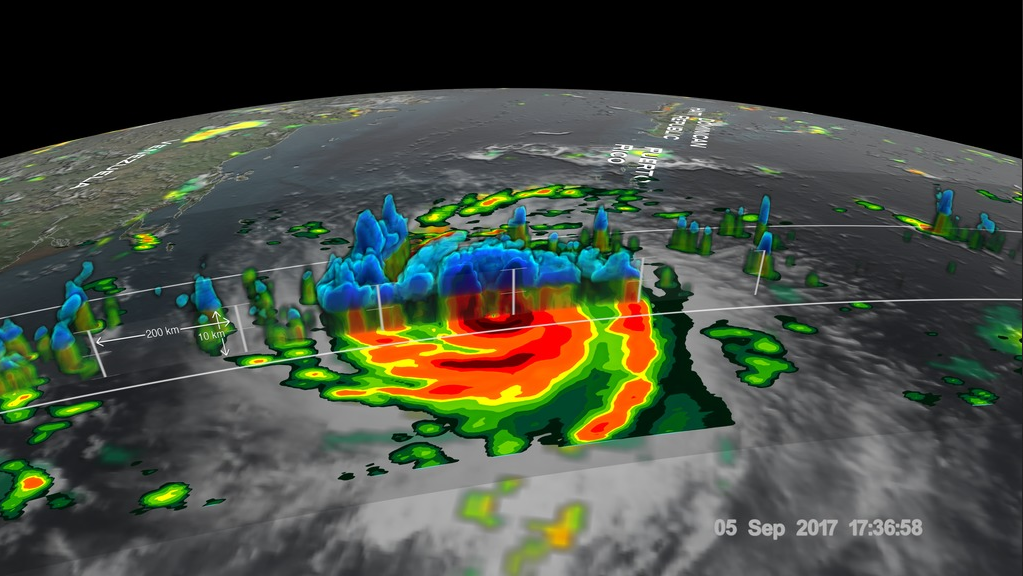 GPM's DPR uncloaked precipitation that was falling at a rate of more than 10.8 inches (274 mm) per hour in the solid ring of powerful storms within Irma's eye wall.
Making Weather Predictions with GPM Data
GPM data is being implemented into the National Weather Service’s (NWS) Advanced Weather Interactive Processing System (AWIPS) that enables forecasters throughout the U.S. to make weather predictions and provide rapid and highly reliable weather warnings and advisories. AWIPS is network of systems that ingest and integrate meteorological, hydrological, satellite and radar data. Furthermore, the Total Operational Weather Readiness- Satellites (TOWR-S) project, which is coupled to AWIPS display and satellite data dissemination development, is using GPM imagery and red-green-blue composites to support the National Hurricane Center (NHC) for tracking and predicting tropical weather systems.
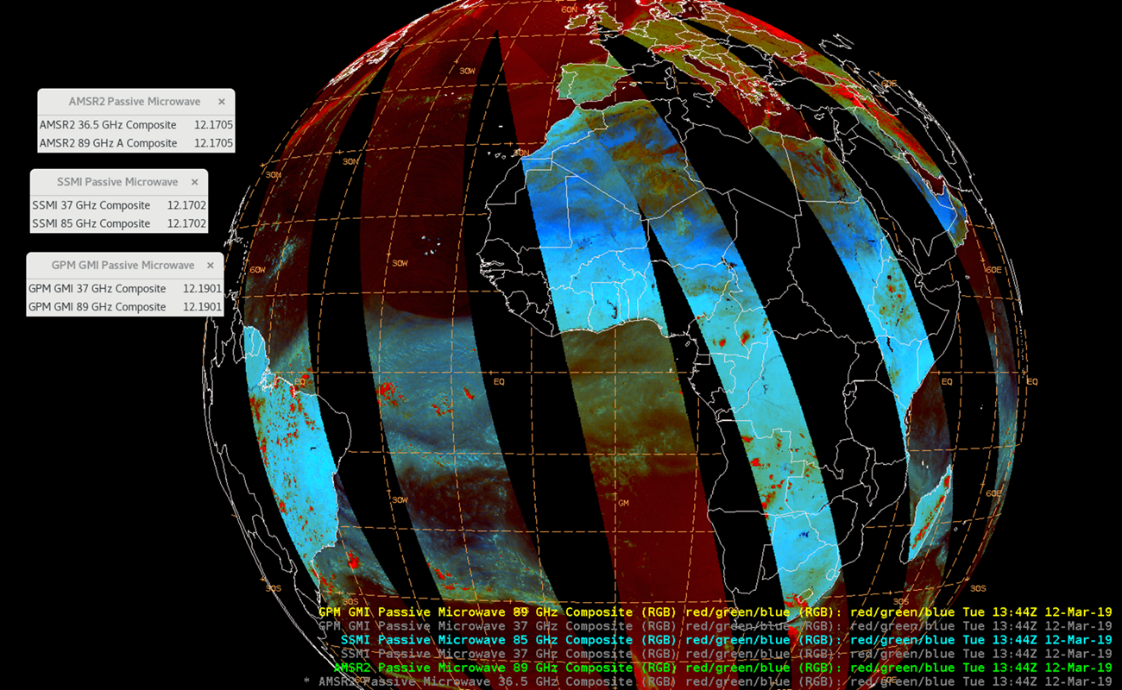 AWIPS Microwave Imagery RGB Composites (AMSR2, GPM, SSMI (F15). Credit: NWS Office of Observations.
GPM Captures Hurricane Willa before Making Landfall
On Sunday, October 21, 2018, the GPM Core Observatory (CO) passed over Hurricane Willa as it was moving northward toward the western coast of Mexico. The hurricane had maximum sustained winds of about 95 mph (109 kts). Since then Willa rapidly intensified with winds over 155 mph (135 kts) making it a dangerous category four storm. GPM's two instruments, GMI and DPR, were used to capture the location and intensity of rainfall, which helped define the storm structure and behavior. GMI data showed that Willa and its feeder bands were producing heavy rainfall over a large area. The location of precipitation in Willa's well defined eye wall was made evident by GPM's DPR. The DPR instrument indicated that a few powerful convective storms within Willa were dropping rain at a rate of over 6.3 inches (160 mm) per hour with storm heights reaching above 8.7 miles (14.0 km). This data was then used by the National Hurricane Center (NHC) to help understand the storms behavior and development as it approached land.
 GPM's GMI/ DPR provides a view of Willa’s precipitation, showing heavy precipitation over a large area (left) and a cross section of Willa using GPM’s DPR on 10/21/2018 (btm. right). Credit: Hal Pierce (SSAI/NASA GSFC). (Above right) NHC used GMI to understand Willa at https://www.nhc.noaa.gov/archive/2018/ep24/ep242018.discus.002.shtml
Extreme Precipitation from Hurricane Florence
Hurricanes can produce some of the heaviest precipitation on planet earth. As a result, they often bring severe floods or flash floods. In the coastal region, hurricane precipitation exacerbates an area already suffering from storm surge. The Extreme Precipitation Monitoring System (ExPreS) is an online system that converts satellite measured precipitation accumulation from the past 1-10 days into corresponding Average Recurrence Interval (ARI) or Return-Year in real-time. In the figures, Hurricane Florence produced over 200 mm rainfall on September 14, 2018, the day it made landfall over North Carolina coastal area. The severity of this rainfall is better captured when this amount of rainfall is converted into once in 50 year event. The current system uses real-time TRMM TMPA data and will be updated with GPM IMERG when the retrospective IMERG becomes available.
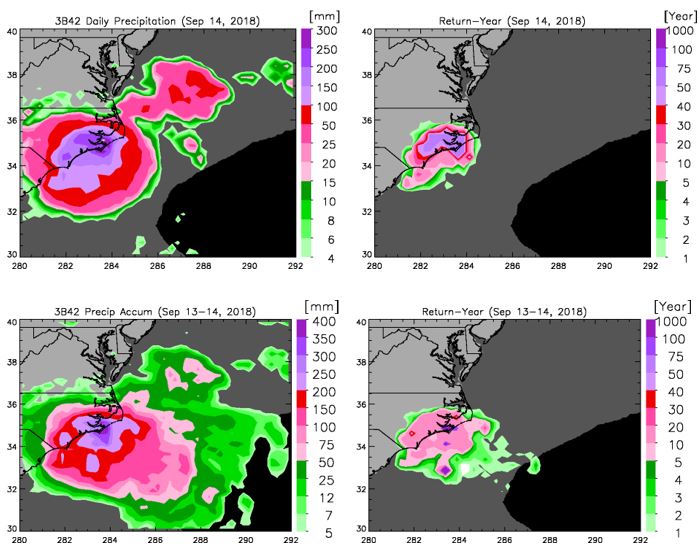 Top images (from left to right): 1-day precipitation accumulation from Hurricane Florence on September 14, 2018 and its corresponding average return interval (AVI or return year) on the day it made landfall in North Carolina. Bottom images (from left to right) show a two-day total precipitation accumulation and its corresponding return year. Image and caption credits: Yaping Zhou, yaping.zhou-1@nasa.gov