

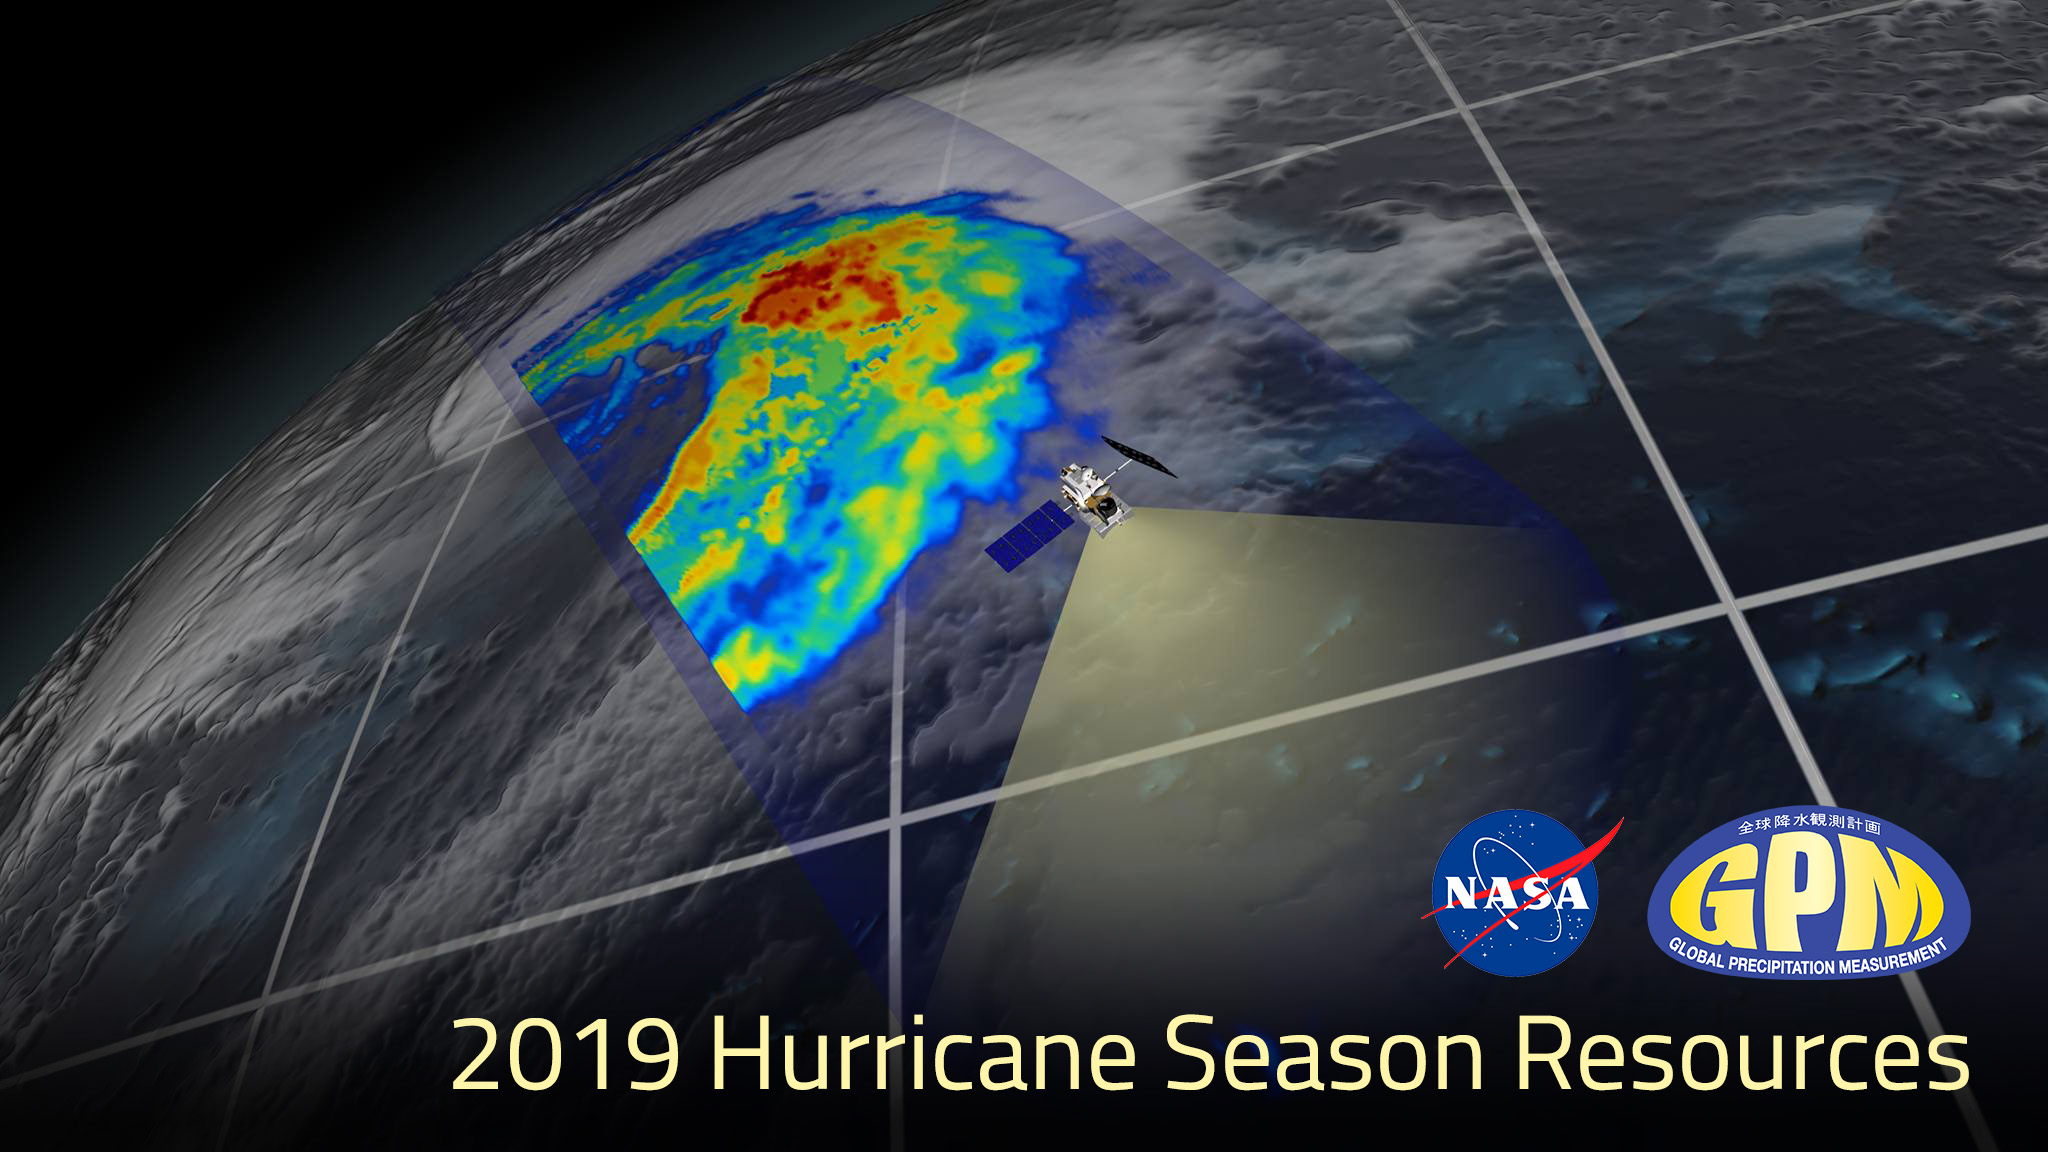
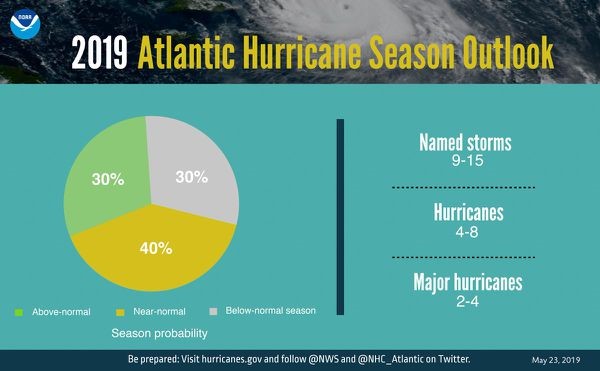
2019 Hurricane Season Resources
NASA Has Eyes On The Atlantic Hurricane Season
NASA has a unique and important view of hurricanes around the planet. Satellites and aircraft watch as storms form, travel across the ocean and sometimes, make landfall. After the hurricanes have passed, the satellites and aircraft see the aftermath of hurricanes, from downed forests to mass power loss. Complete transcript available.
Music credit: "Northern Breeze" by Denis Levaillant [SACEM], "Stunning Horizon" by Maxime Lebidois [SACEM], Ronan Maillard [SACEM], "Magnetic Force" by JC Lemay [SACEM] from Killer Tracks
This video is public domain and along with other supporting visualizations can be downloaded from the Scientific Visualization Studio at: http://svs.gsfc.nasa.gov/13216
Credit: NASA's Goddard Space Flight Center/Joy Ng
The Art of Creating Digital Hurricanes
Credits: NASA Goddard / Ryan Fitzgibbons
Download high-resolution video at NASA’s Scientific Visualization Studio
Using GPM Data to Understand Hurricanes
 GPM's DPR uncloaked precipitation that was falling at a rate of more than 10.8 inches (274 mm) per hour in the solid ring of powerful storms within Irma's eye wall.
 The 2019 Atlantic "hurricane season" is officially upon us and runs through November 30th. Did you know that GPM data play a fundamental role in the ability to monitor existing storm activity such as capturing the location and intensity of rainfall inside a storm, as well as improving weather and precipitation forecasts through assimilation of instantaneous precipitation information? Here are a few applications of GPM data used to study hurricanes and how the data was then used for decision-making.
How Does NASA Study Hurricanes?
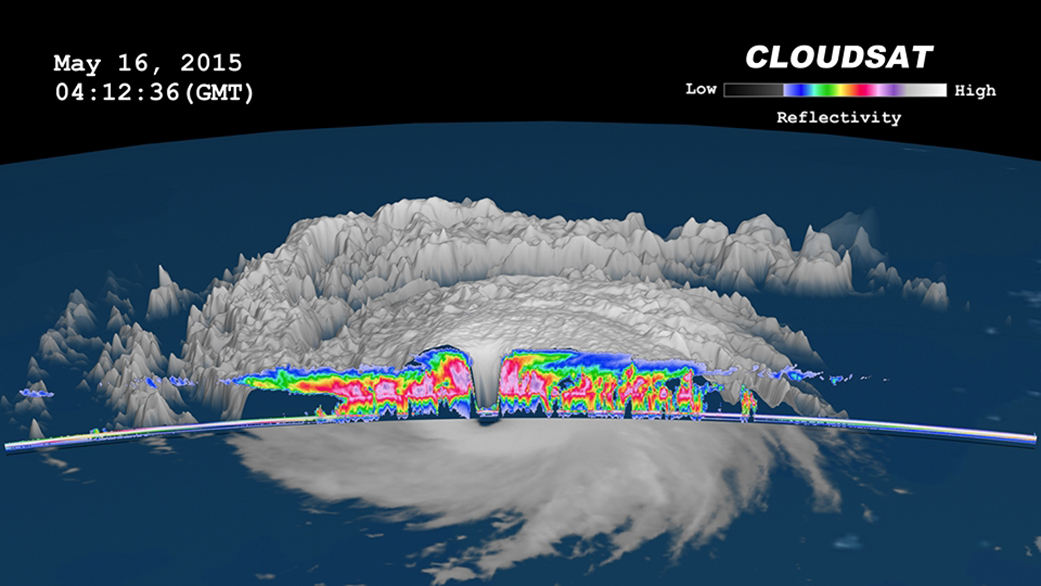 MTSTAT and CloudSat imagery of Typhoon Dolphin.
Credits: Natalie D. Tourville/Colorado State University
Hurricanes are the most powerful weather event on Earth. NASA’s expertise in space and scientific exploration contributes to essential services provided to the American people by other federal agencies, such as hurricane weather forecasting. NASA’s role as a research agency is to bring new types of observational capabilities and analytical tools to learn about the fundamental processes that drive hurricanes and work to help incorporate that data into forecasts. NASA collaborates with interagency partners such as NOAA so that the nation benefits from our respective capabilities.
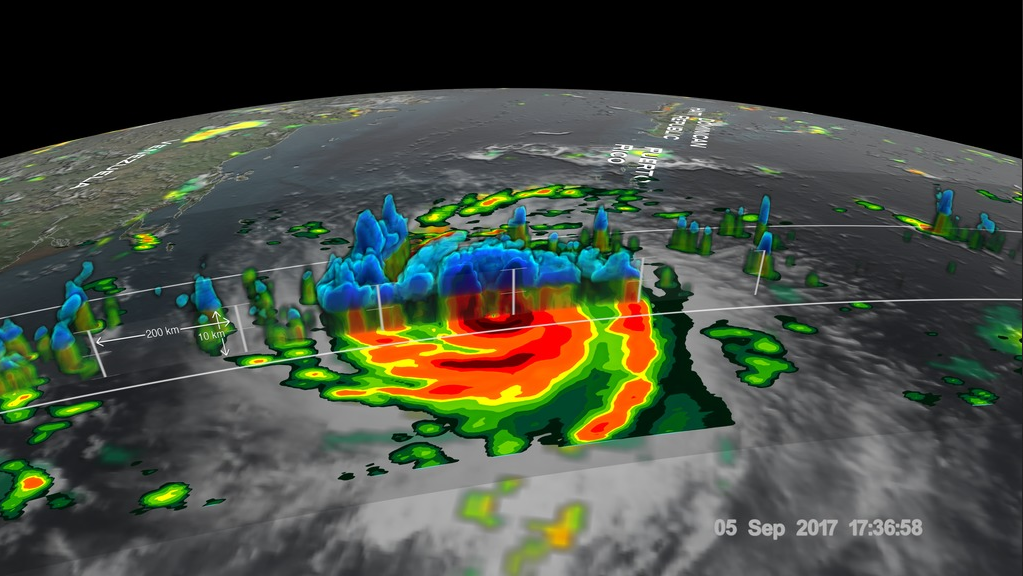
Dive Into a 360° View of Hurricane Maria
For the first time in 360 degrees, this data visualization takes you inside Hurricane Maria. Click and drag within the video to look around.
Credits: NASA's Goddard Space Flight Center
Download this video and supporting visuals from the Scientific Visualization Studio
Two days before Hurricane Maria devastated Puerto Rico, the NASA/JAXA Global Precipitation Measurement Core Observatory satellite captured a 3D view of the 2017 storm. For the first time in 360 degrees, this data visualization takes you inside the hurricane. The precipitation satellite has an advanced radar that measures both liquid and frozen water. The brightly colored dots show areas of rainfall, where green and yellow show low rates and red and purple show high rates. At the top of the hurricane, where temperatures are colder, blue and purple dots show light and heavy frozen precipitation. The colored areas below the dots show how much rain is falling at the surface.
Interactive Hurricane Resources
STORM Event Viewer
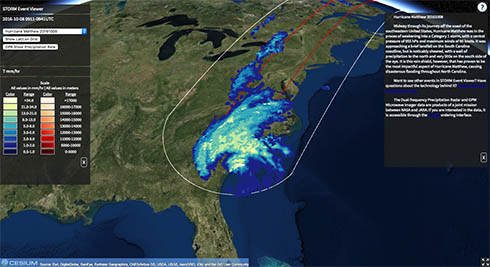
This web-browser based visualization tool from the the NASA Precipitation Processing System allows you to view 2D and 3D precipitation data collected by the GPM satellite from some of the latest extreme weather events across the world.
2019 Hurricane Season iQuest
Follow along with this interactive iQuest to find out about predictions for the 2019 hurricane season and discover how hurricanes form. You will also learn how NASA satellite data is being used to help predict, monitor, and respond to these deadly storms.
Build a 3D LEGO Model of Hurricane Irma using GPM Precipitation Data
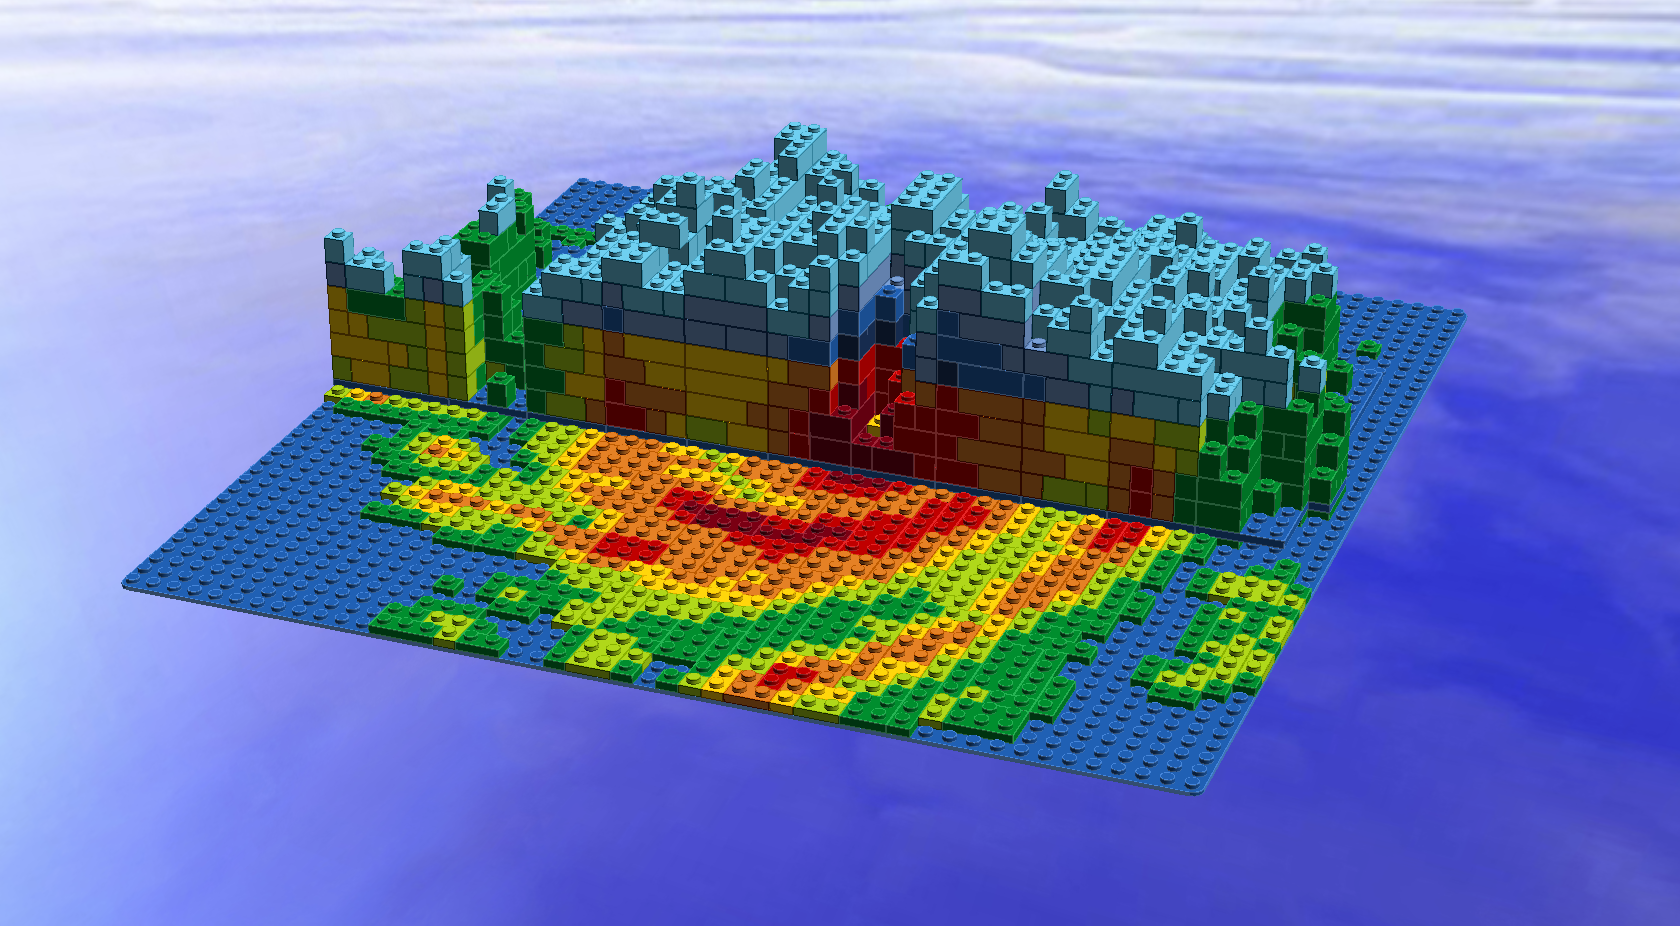
This activity from the NASA Precipitation Education website provides step-by-step instructions and a parts list to build your own LEGO model of GPM precipitation data collected from Hurricane Irma on 9/5/17.