
Dive Into a 360-View of Hurricane Maria
Two days before Hurricane Maria devastated Puerto Rico, the NASA/JAXA Global Precipitation Measurement Core Observatory satellite captured a 3D view of the 2017 storm. At the time Maria was a category 1 hurricane. The 3-D view reveals the processes inside the hurricane that would fuel the storm’s intensification to a category 5 storm within 24 hours.
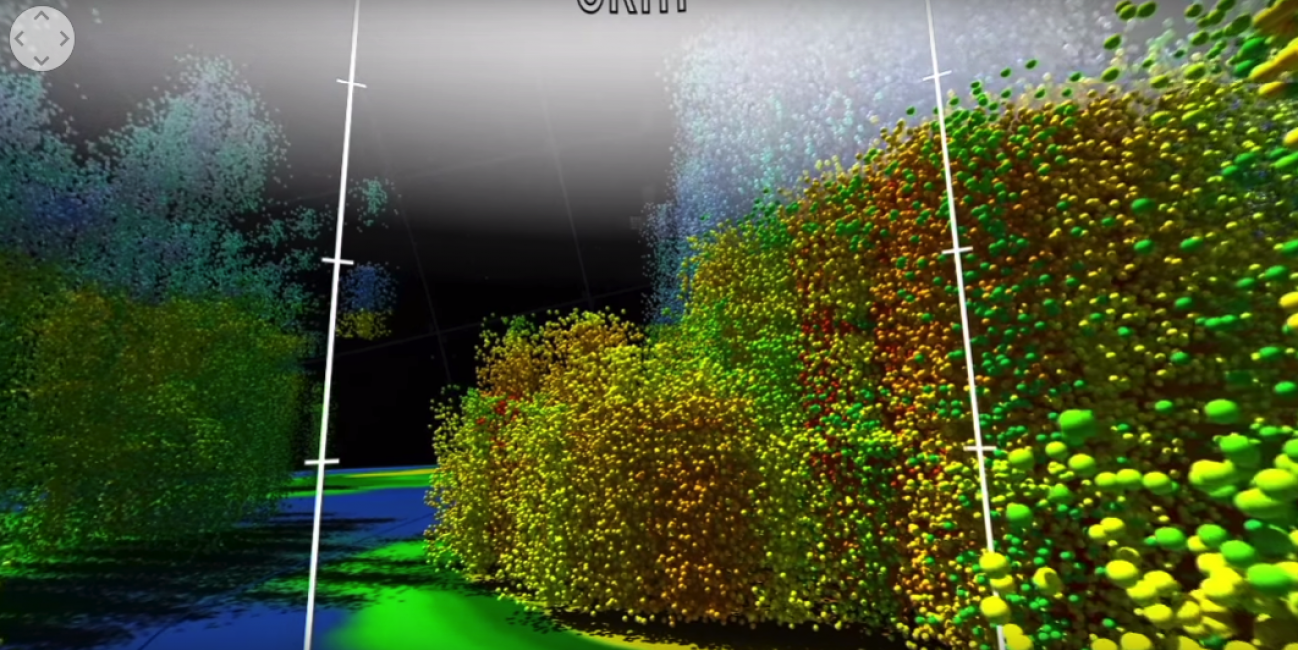
For the first time in 360 degrees, this data visualization takes you inside the hurricane. The precipitation satellite has an advanced radar that measures both liquid and frozen water. The brightly colored dots show areas of rainfall, where green and yellow show low rates and red and purple show high rates. At the top of the hurricane, where temperatures are colder, blue and purple dots show light and heavy frozen precipitation. The colored areas below the dots show how much rain is falling at the surface.
For the first time in 360 degrees, this data visualization takes you inside Hurricane Maria. Click and drag within the video to look around.
Credits: NASA's Goddard Space Flight Center
Download this video and supporting visuals from the Scientific Visualization Studio
As the visualization progresses, the dots transform into numbers, which are the observed millimeters of precipitation that fall in an hour. The rates in this storm vary from less than 0.5 mm/hr to more than 150 mm/hr. The visualization next transforms these precipitation rates into ellipsoids to show higher (wide, red or purple) or lower (spherical, green or yellow) rainfall rates and snowfall rates (purple to blue colors). In addition to rain and snowfall rates, the satellite can also measure the sizes of tiny precipitation particles and how they are distributed throughout the storm. Toward the end of the visualization, big drops are depicted in dark blue and small drops in light blue and white.
Looking at drop sizes and rainfall rates provides a key part of the equation in understanding hurricane intensity. Factors such as temperature, humidity, wind speed and clouds influence the size of precipitation particles, which in turn affects how much rain falls and how a storm grows. These advanced satellite measurements are critical for improving forecasts of how these powerful storms may intensify and where they may go.
By Ellen Gray
NASA's Earth Science News Team