

Drought and the Australia Wildfire Season
Droughts and dry, arid conditions are naturally occurring phenomena in Australia. Such an environment is conducive to wild fires, which are started mainly by lightning and can occur throughout the year, but typically emerge between October and April and are most prevalent during the Southern Hemisphere summer; they are part of the seasonal cycle in Australia. However, some years are worse than others, and the 2019-2020 wild fire season was especially bad. It has been estimated that upwards of 46 million acres were burned, or roughly the size of the entire state of Washington. In terms of area, the Northern Territory, New South Wales, Queensland and Western Australia had the most acres burned followed by Victoria. According to media reports New South Wales had the most homes lost (over 2400) and the greatest number of fatalities (25), while Victoria has had the second biggest loss of homes (around 400) and lives (5).
The 2019-2020 wild fire season was primed by the current on-going drought conditions across much of Australia, including New South Wales, Queensland, and parts of Victoria, South Australia and Western Australia. In addition to its generally flat topography, being located in the subtropics in the descending branch of the Hadley Circulation, and its proximity to cold ocean currents, there are three additional factors that occur on seasonal time scales that can lead to dry conditions across Australia: the El Niño-Southern Oscillation (ENSO), the Indian Ocean Dipole, and the Southern Annual Mode. El Niño and La Niña events have a big impact on Australia. During an El Niño, warm Pacific waters are shifted eastward, taking rainfall with it and away from Australia, which leads to droughts in Australia. Many major droughts in Australia are a direct result of El Niño conditions. The opposite is true during a La Niña, which brings warmer-than-normal waters to the western Pacific, enhanced rainfall, and often flooding conditions to Australia. ENSO has not been a major influence in the current drought with conditions being mostly within the neutral range over the past 3 years; however, the moderate to weak 2018-2019 central Pacific El Niño certainly did not help matters.
Instead, more recently, a strong, positive Indian Ocean Dipole (or IOD) and a persistent negative Southern Annular Mode (SAM) are largely to blame for sustaining the widespread drought conditions across Australia. The IOD acts like a mini-ENSO with enhanced ascent and rainfall linked to areas of warmer-than-average sea surface temperatures (SSTs) and subsidence and suppressed rainfall co-located with areas of below average SSTs. In its positive phase, SSTs are above normal east of Africa and below normal northwest of Australia; this both shifts rain away from Australia and leads to hotter and drier air over the Australian continent, prime conditions for wild fires. The IOD index, which is monitored by the Australian Bureau of Meteorology (BOM), turned strongly positive in June of 2019 and remained that way through December. The SAM refers to the belt of westerly winds located south of Australia over the Southern Ocean. In its negative phase, this band of westerly winds expands northward, which increases the flow of drier air from the interior to over eastern Australia while reducing moist onshore flow there, bringing drier-than-normal conditions to the eastern parts of the country as well as the southeastern during summer. The SAM can oscillate at shorter, weekly time scales but was predominantly negative from July through December of 2019.
The combination of a positive IOD and negative SAM for the latter half of 2019 meant that rainfall was scarce over Australian, setting the stage for the terrible 2019-2020 wild fire season. IMERG, the Integrated Multi-satellitE Retrievals for GPM, is a unified satellite precipitation product produced by NASA to estimate surface precipitation over most of the globe. With IMERG, precipitation estimates from the GPM core satellite are used to calibrate precipitation estimates from microwave and IR sensors on other satellites. By then merging the estimates from multiple satellites, surface precipitation maps can be produced half-hourly at 0.1 degree horizontal resolution. The following series of images show monthly IMERG surface rainfall accumulations over Australia from October of 2019 through February of 2020.
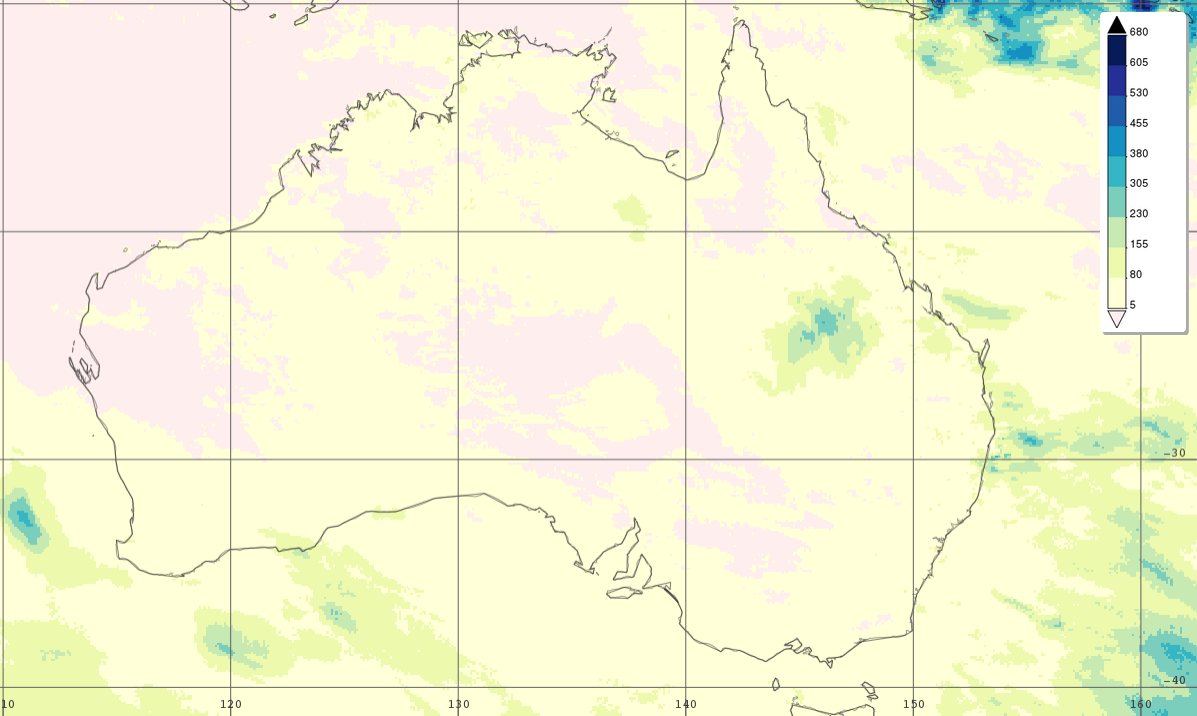 Surface rainfall accumulations (mm) estimated from the NASA IMERG satellite precipitation product from 1 to 31 October 2019 over Australia and the surrounding waters.
For October, IMERG shows that the vast majority of Australia was dry with many areas across the country receiving less than 5 mm of rain (shown in pink) with the exception of central Queensland and right along parts of the central east coast and southwestern coastline. In October, several bush fires were reported in Queensland, New South Wales, and South Australia.
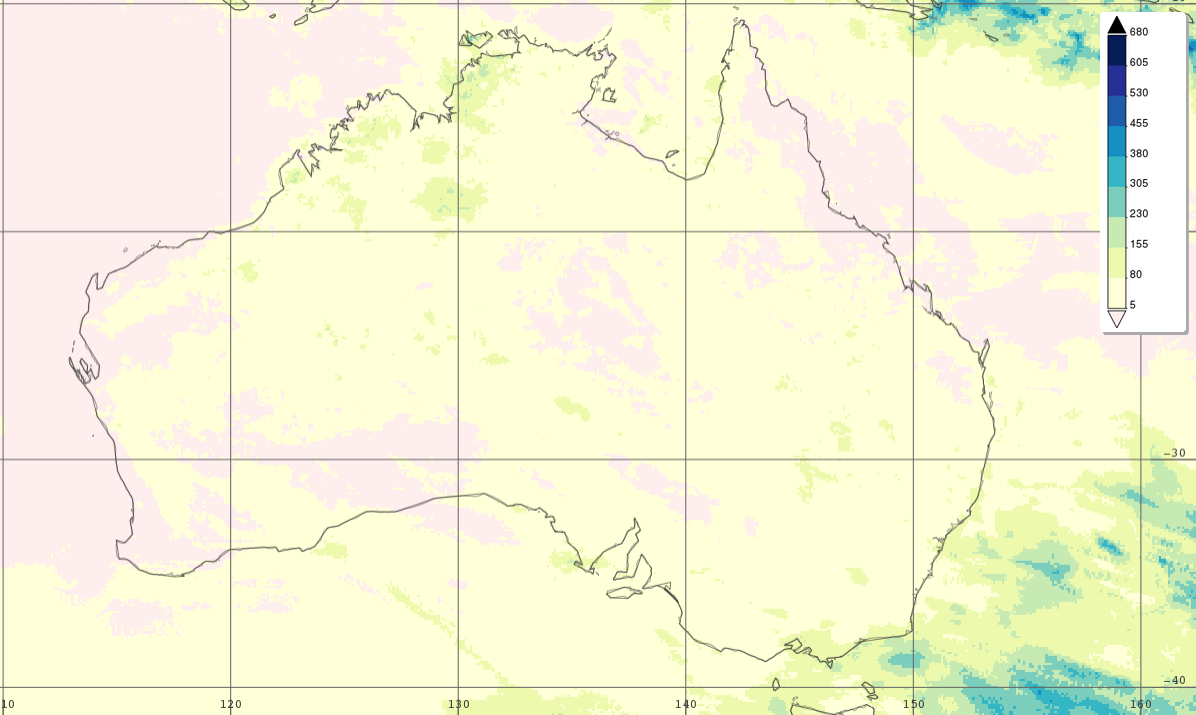 Surface rainfall accumulations (mm) estimated from the NASA IMERG satellite precipitation product from 1 to 30 November 2019 over Australia and the surrounding waters.
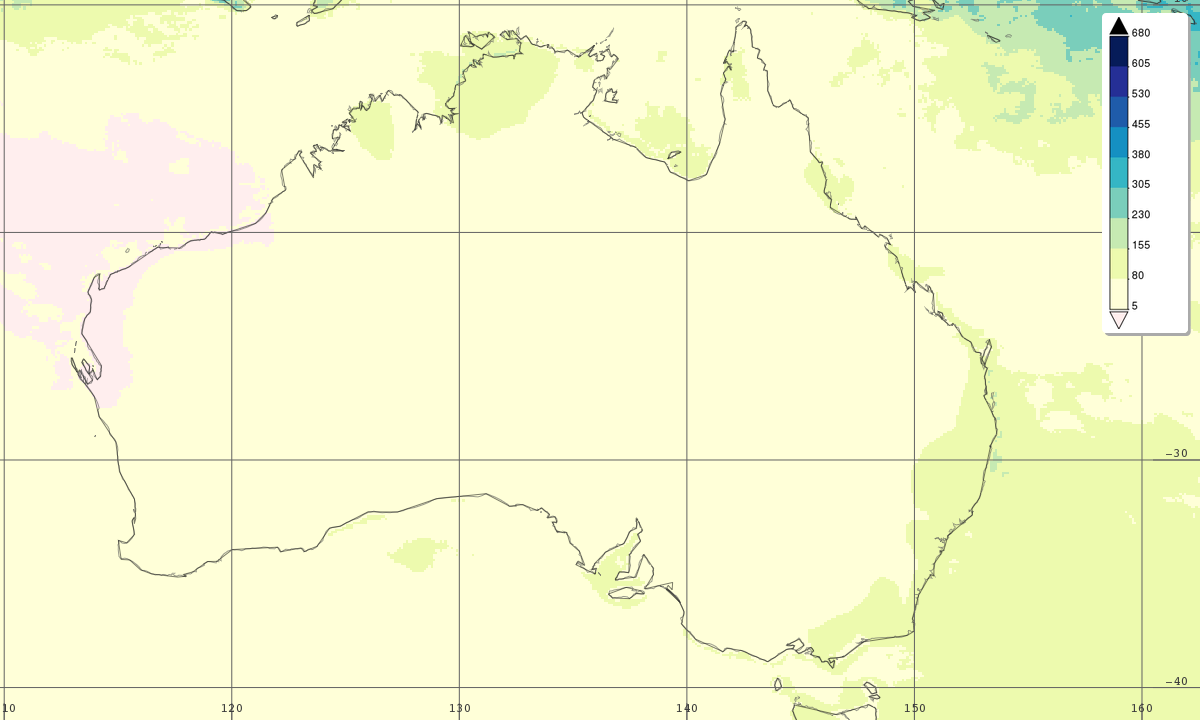 Average monthly surface rainfall accumulations (mm) for the month of November estimated from the NASA IMERG satellite precipitation product from 2000 to 2019 over Australia and the surrounding waters.
For November (which as shown by the IMERG monthly average is already a dry month), the situation is largely the same with generally dry conditions covering most of the country with modest amounts of rainfall (over 80 mm, ~3 inches, shown in light green) falling only along and inland of the north-central coast and right along the southern coast of Victoria as well a few localized areas in the interior. More significant rain remained well offshore of the southeast coast. Overall, the BOM reported that for the country as a whole, it was the driest November on record dating back to 1900. The fire situation in November worsened with many fires reported in Queensland and Victoria as well as the eruption of major fires in New South Wales.
 Surface rainfall accumulations (mm) estimated from the NASA IMERG satellite precipitation product from 1 to 31 December 2019 over Australia and the surrounding waters.
 Average monthly surface rainfall accumulations (mm) for the month of December estimated from the NASA IMERG satellite precipitation product from 2000 to 2019 over Australia and the surrounding waters.
December shows signs of the start of the monsoon with an increase in rainfall along parts of the northern coastline and Western Australia but very dry conditions over most of the eastern half of the country with the exception of parts of the immediate coastline. The IMERG monthly average rainfall map for December shows a similar general pattern but with much a greater coverage on average of moderate rainfall (over 80 mm) extending well inland across the entire northern third of the country through much of Queensland and down along almost the entire eastern coast. According to the BOM, December of 2019 was the driest as well as the hottest December on record for Australia as a whole. In December, intense wild fires burned in Victoria while bushfires continued in New South Wales.
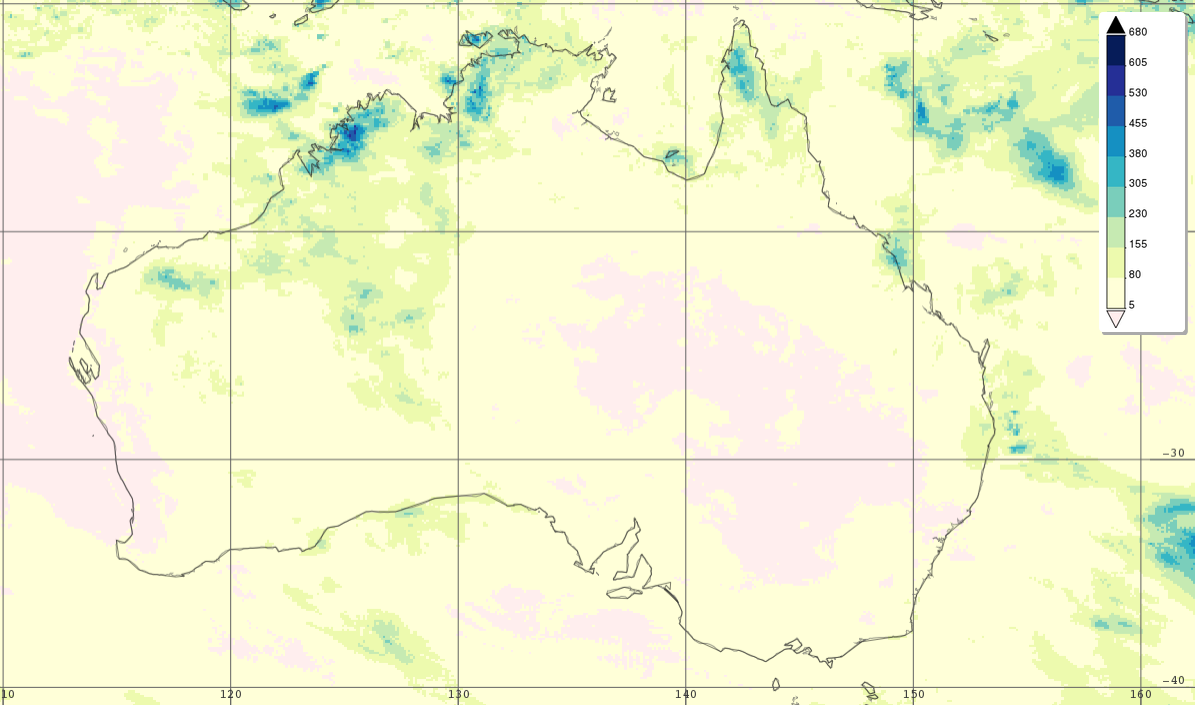
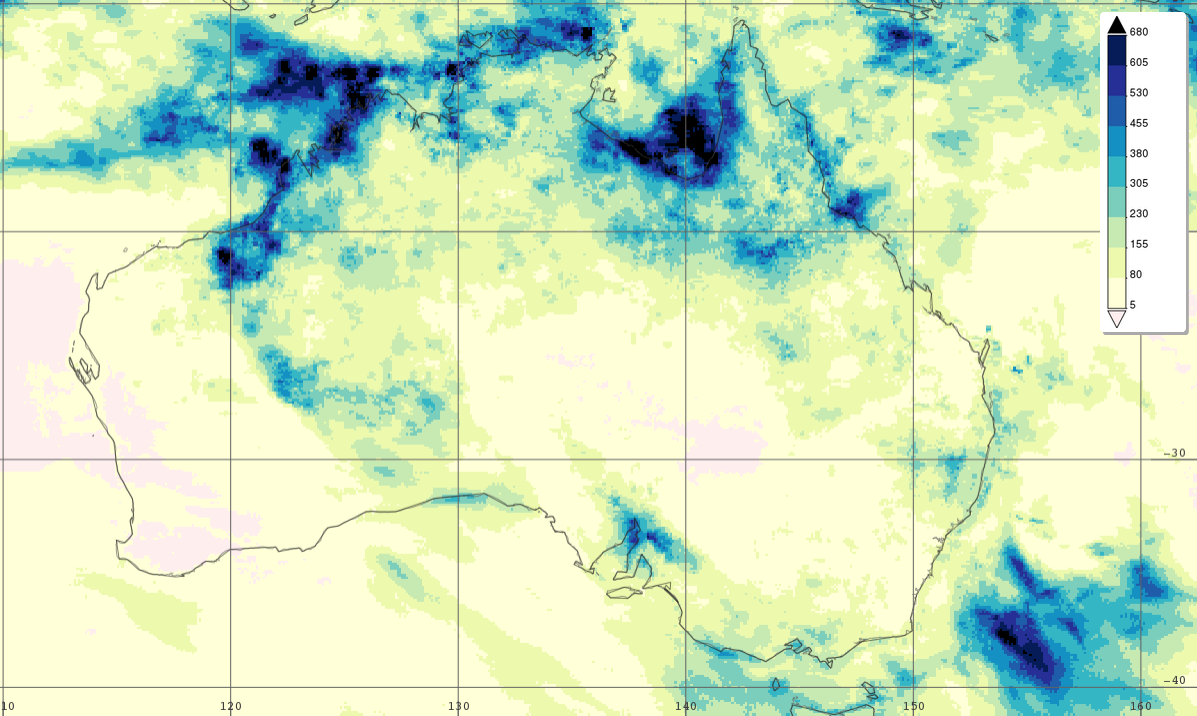 Surface rainfall accumulations (mm) estimated from the NASA IMERG satellite precipitation product from 1 to 31 January 2020 over Australia and the surrounding waters.
In January IMERG shows the arrival of much needed rain across a good portion of the country with heavy rains from about 300 to over 600 mm (~12 to 24 inches, shown in moderate to dark blue) falling over much of northern Queensland and the Gulf of Carpentaria westward across parts of the Northern Territory, all along the northwest coast and back into interior sections of Western Australia. In addition, fairly widespread areas of moderate rain fell across portions of South Australia, Victoria, New South Wales and southern Queensland as a result of strong storms, bringing some much needed relief from the wildfires in those areas.
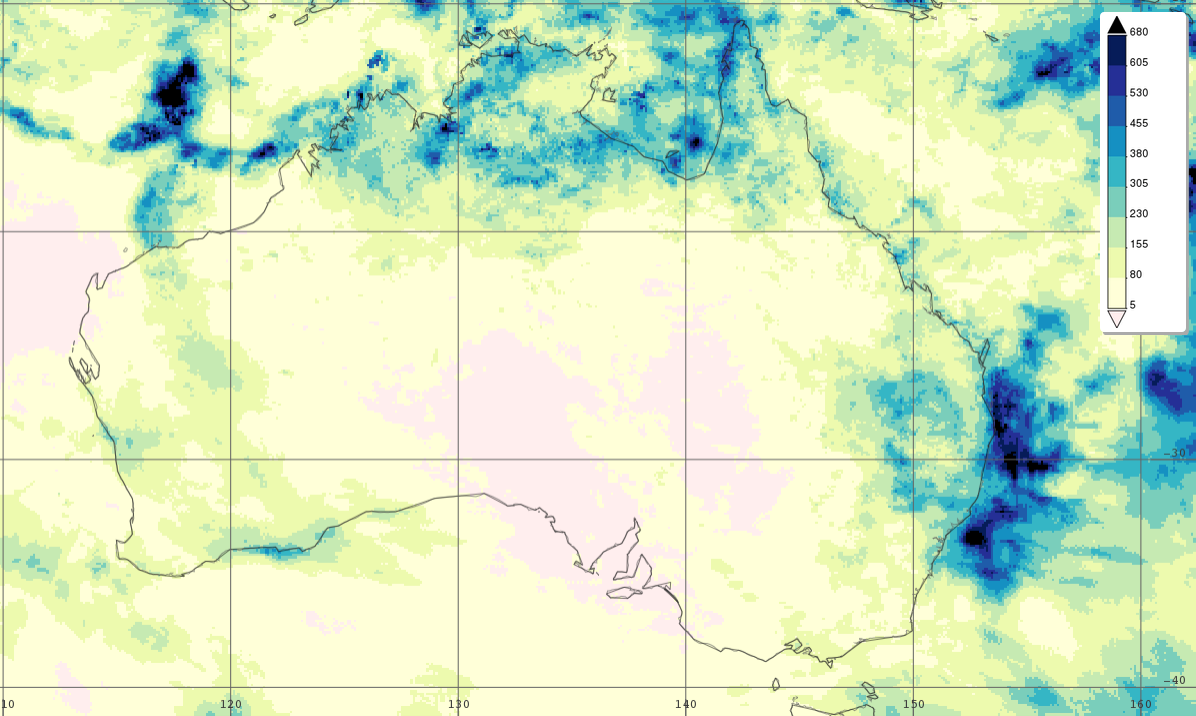 Surface rainfall accumulations (mm) estimated from the NASA IMERG satellite precipitation product from 1 to 29 February 2020 over Australia and the surrounding waters.
Finally, in February IMERG shows continued moderate to sometimes heavy rain across the northern third of the country as well as areas of moderate rainfall over interior parts of Western Australia associated largely with the passage of the remnants of Tropical Cyclone Damien. But, more significantly regarding the wildfires in southeastern Australia, significant areas of more substantial rainfall (from about 150 to over 300 mm, ~6 to 12 inches, shown in medium green and blue) extend well inland from the east coast to over southern Queensland and much of the eastern half of New South Wales, effectively bringing an end to the severe 2019-2020 fire season.
Text by Steve Lang (NASA GSFC)
Images from NASA GSFC using IMERG data archived ath https://giovanni.gsfc.nasa.gov/giovanni/. These image were produced with the Giovanni online data system, developed and maintained by the NASA GES DISC.