drought

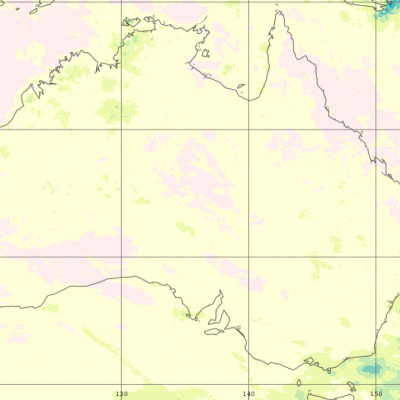
IMERG rainfall totals from Australia in November 2019
Droughts and dry, arid conditions are naturally occurring phenomena in Australia. Such an environment is conducive to wild fires, which are started mainly by lightning and can occur throughout the year, but typically emerge between October and April and are most prevalent during the Southern Hemisphere summer; they are part of the seasonal cycle in Australia. However, some years are worse than others, and the 2019-2020 wild fire season was especially bad. It has been estimated that upwards of 46 million acres were burned, or roughly the size of the entire state of Washington. In terms of area...
IMERG Sees a Dry September
Rainfall was scarce across much of the country in the month of September, pushing the eastern and southern thirds of the country into drought conditions. IMERG, the Integrated Multi-satellitE Retrievals for GPM, is a unified satellite precipitation product produced by NASA to estimate surface precipitation over most of the globe.

Pineapple Express Delivers Heavy Rains, Flooding, Drought Relief to California

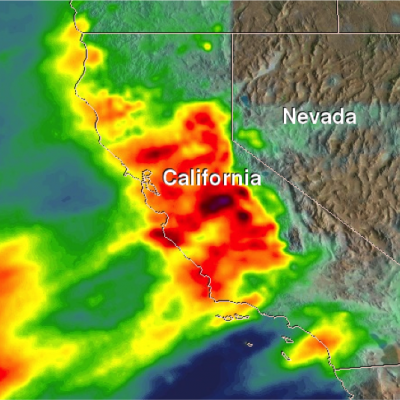
An atmospheric river (“Pineapple Express”) delivered over 5 inches of rainfall in parts of California during January 3-10, 2017 (bottom) as viewed by GPM’s IMERG data. California, which has long been suffering through a strong, multi-year drought, is finally beginning to see some much needed relief as a result of a recent series of storms that are part of a weather pattern known as the “Pineapple Express.” The Pineapple Express is known as an atmospheric river. A large, slow-moving low pressure center off of the West Coast taps into tropical moisture originating from as far south as the
A Tale of Two Extremes: Rainfall Across the US
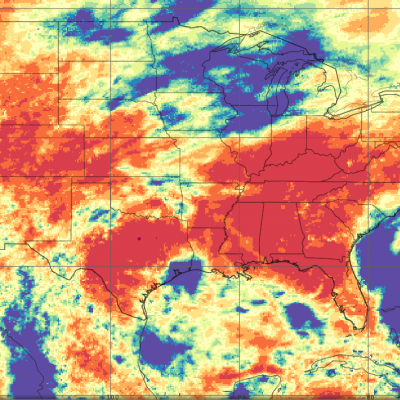
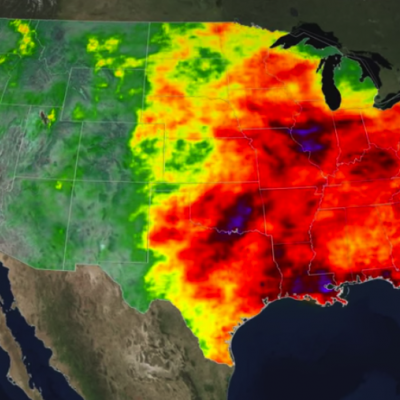
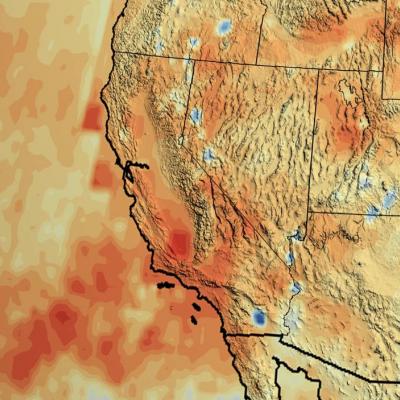
The United States has seen a tale of two extremes this year, with drenching rains in the eastern half of the country and persistent drought in the west. A new visualization of rainfall data collected from space shows the stark contrast between east and west for the first half of 2015. The accumulated precipitation product visualized here begins on Jan. 1, 2015, and runs through July 16, 2015. This visualization shows the heavy rainfall throughout Northern Texas and across Oklahoma as well as the drought in Southern California. Credits: NASA Goddard's Scientific Visualization Studio Download...
California “Rain Debt” Equal to Average Full Year of Precipitation
California's accumulated precipitation “deficit” from 2012 to 2014 shown as a percent change from the 17-year average based on TRMM multi-satellite observations. Credits: NASA/Goddard Scientific Visualization Studio A new NASA study has concluded California accumulated a debt of about 20 inches of precipitation between 2012 and 2015 -- the average amount expected to fall in the state in a single year. The deficit was driven primarily by a lack of air currents moving inland from the Pacific Ocean that are rich in water vapor. In an average year, 20 to 50 percent of California's precipitation...

Wall of Dust, by Meggan Wood

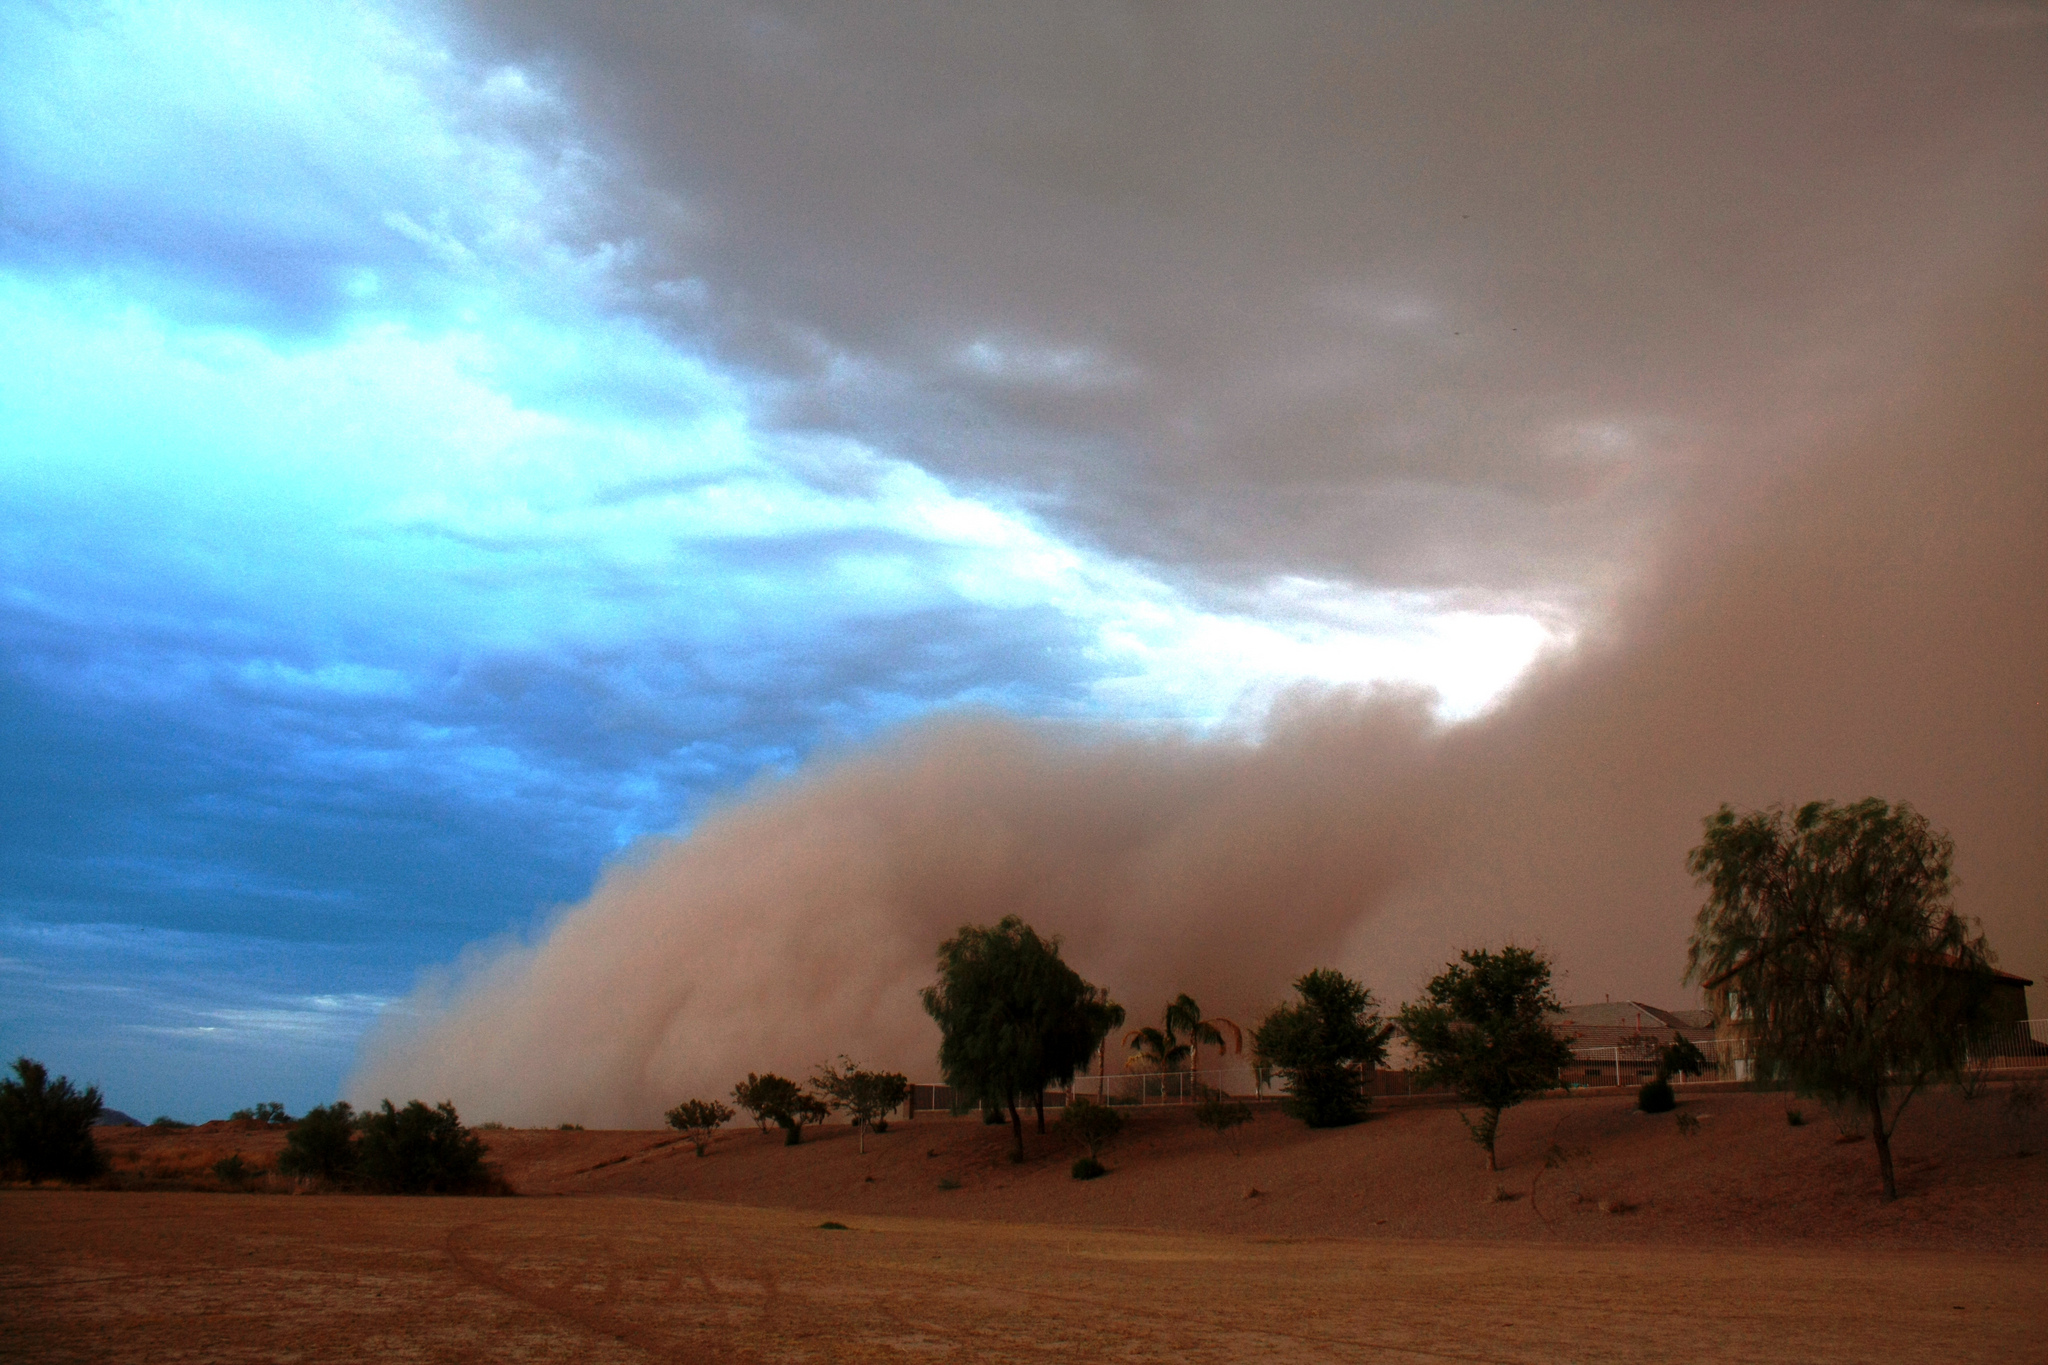
A huge dust storm approaching
Image Caption
A huge dust storm approaches Maricopa, Arizona.

Date and Location:
July 5, 2011
Maricopa, Arizona

How this Photo was Taken:
“This photo was taken in a wash that runs through my neighborhood in Maricopa, AZ. The wash runs north/south through the neighborhood and the haboob (type of intense dust storm) was rolling in from the east.

It was taken on 7/5/11 in the afternoon, not long before sunset.