GPM Measures Tropical Cyclone Debbie
Tropical cyclone Debbie formed in the Coral Sea northeast of Australia om March 24, 2017. Debbie intensified and had hurricane force wind speeds within a day of formation. While headed toward northeastern Australia Debbie reached it's maximum sustained wind speeds estimated at over 100 kts (115 mph) on March 27, 2017 (UTC). Tropical cyclone Debbie came ashore on March 28th and brought destructive winds and extremely heavy rain to northeastern Australia. It was reported that heavy rainfall caused flash flooding that cut off a coastal town and covered several roads in Queensland.
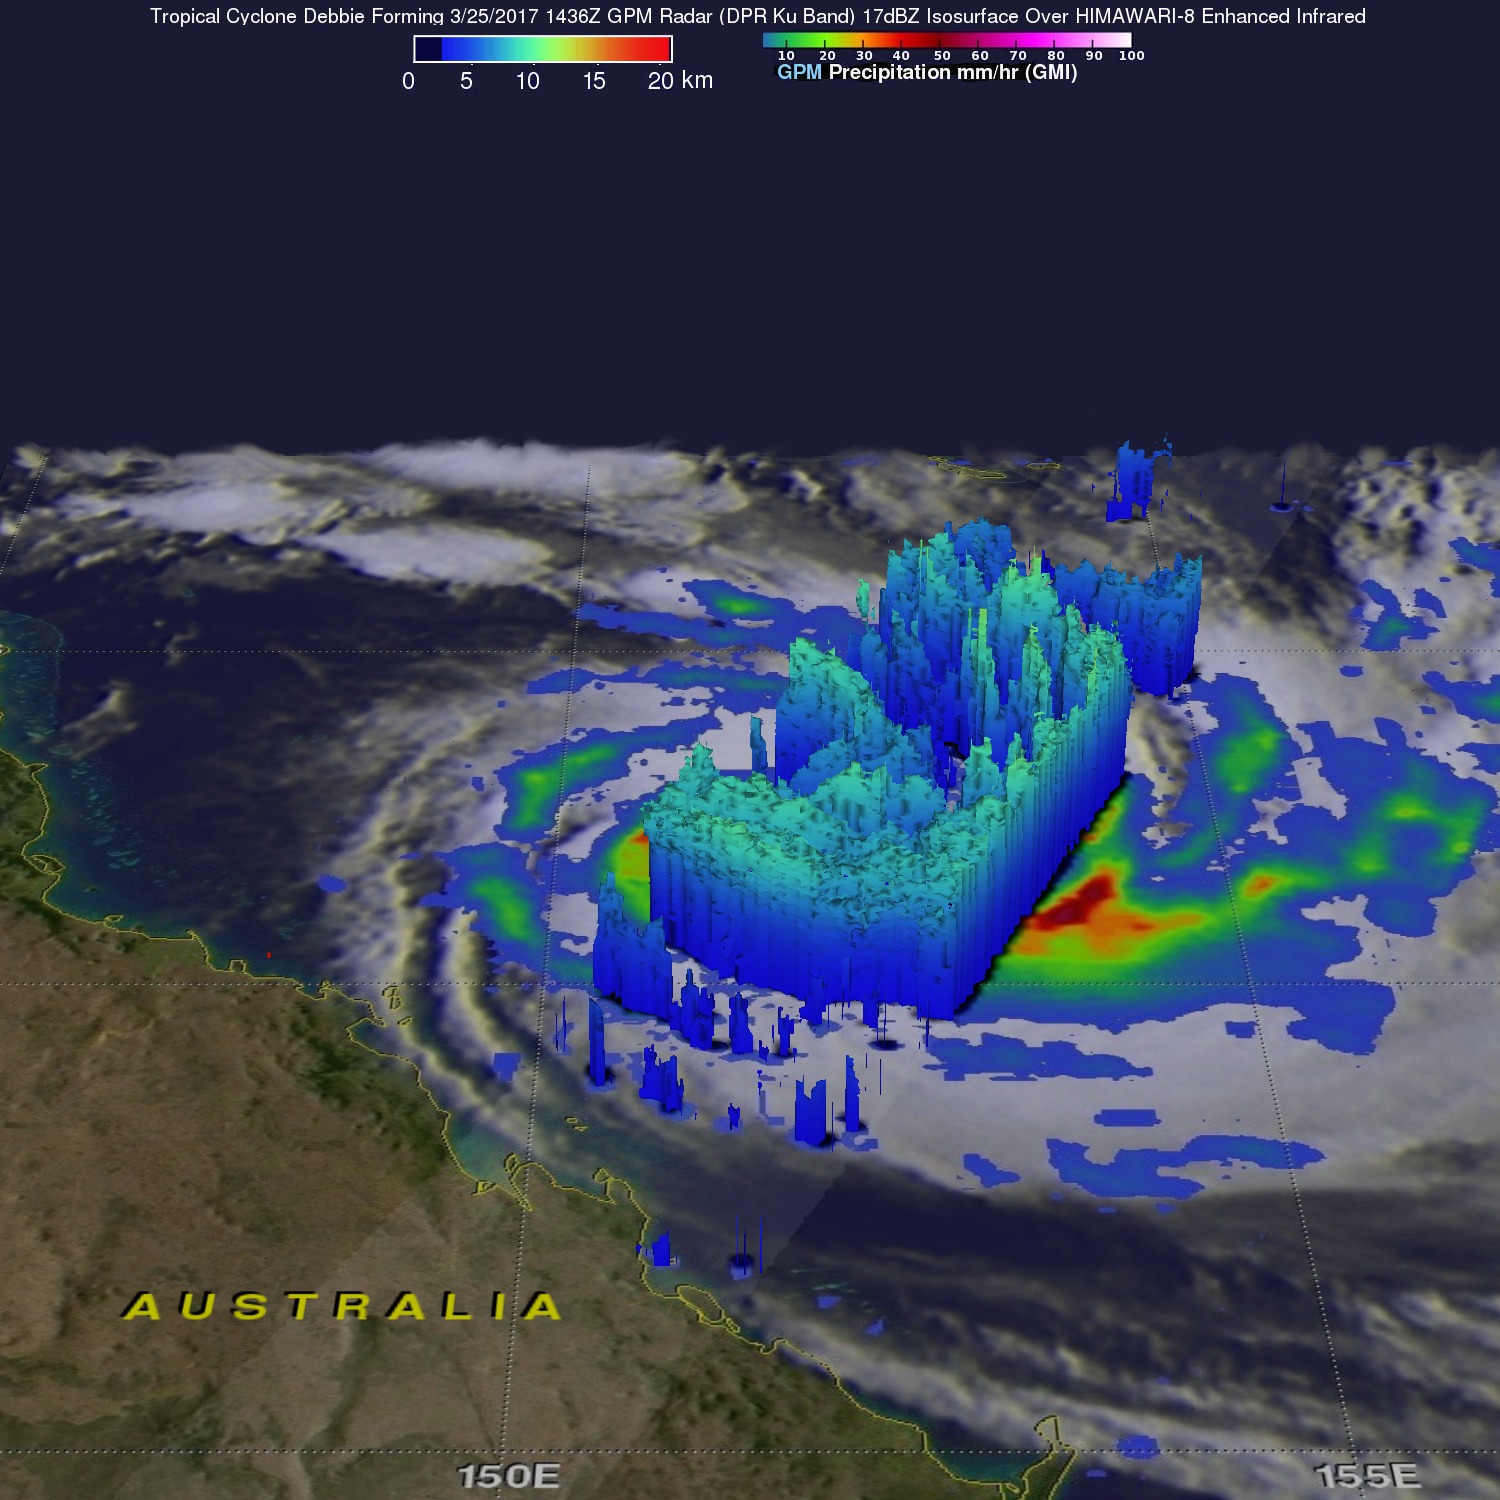
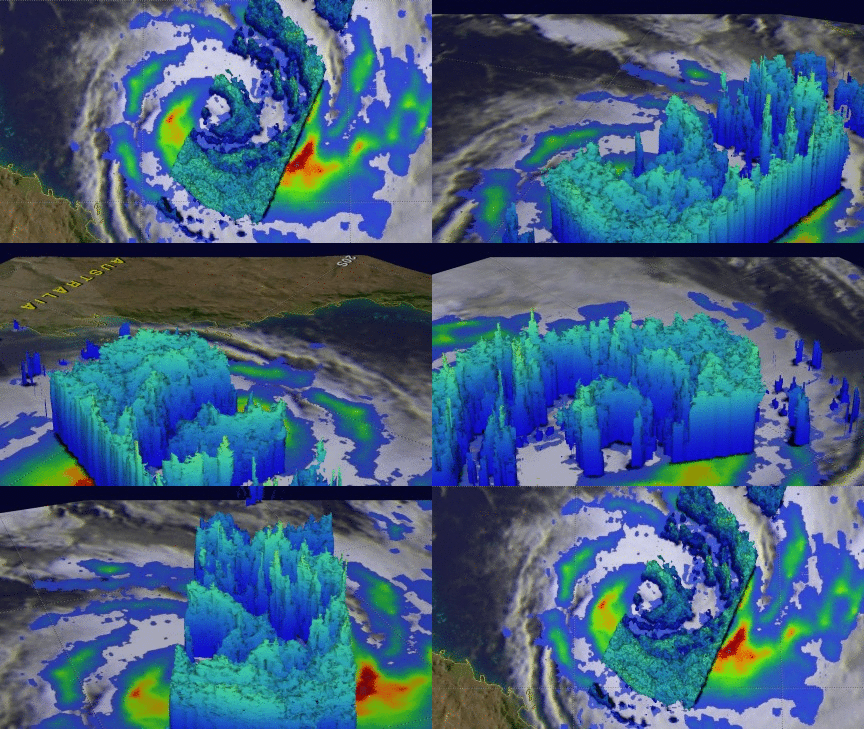
The GPM satellite viewed Debbie several times during it's trek toward Australia. GPM flew over the tropical cyclone in the Coral Sea on March 24th shortly before it was assigned a name. With that pass GPM saw that the forming tropical cyclone was getting organized and contained bands of heavy rainfall south of the center of circulation. Debbie was close to hurricane intensity with bands of very heavy rain spiraling into the tropical cyclone when GPM passed over on March 25 at 1436 UTC. GPM's Microwave Imager (GMI) showed a Debbie had an eye on March 26th. Intense bands of rain circling a well defined eye were revealed by GPM's GMI on March 27, 2017.

The GPM satellite flew above the center of intensifying tropical cyclone Debbie on March 25th. GPM's radar data (DPR ku Band) collected with that pass showed that many storm tops in feeder bands around the tropical cyclone were reaching heights above 13 km (8 miles).
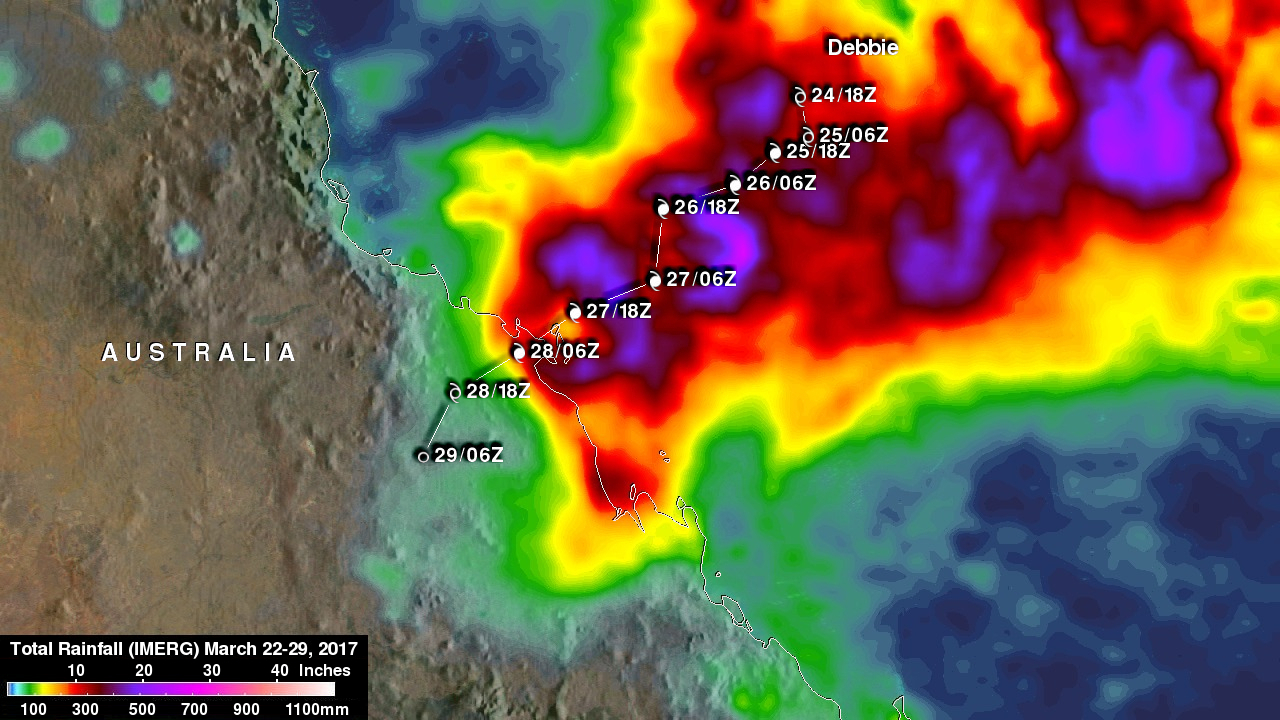
Near "real time" rainfall data shown here were available at half hourly intervals from NASA's Integrated Multi-satelliE Retrievals for GPM (IMERG) data. Those IMERG data were produced using data collected over Australia from satellites in the GPM Constellation. Those data are calibrated with measurements from the GPM Core Observatory as well as rain gauge networks around the world.
This analysis of total rainfall with tropical cyclone Debbie used IMERG data that were collected from March 22 to 29, 2017. This analysis covers the period from when Debbie was forming over the Coral Sea until the tropical cyclone dissipated over the interior of northeastern Austalia. IMERG indicated that rainfall totals were greater than 500 mm (~ 20 inches) along many parts of Debbie's track. IMERG indicates that the most extreme rainfall fell along the coast where Debbie came ashore. Rainfall totals fell off rapidly as the tropical cyclone moved over land and dissipated. IMERG rainfall totals have been adjusted to reflect observed values in other similar extreme rainfall events.
Images and Captions by Hal Pierce (SSAI/NASA GSFC)


