

IMERG Measures Rainfall in Hurricane Dorian
UPDATE 9/9/19:
On Monday morning, September 9, Hurricane Dorian was a post-tropical storm after a mid-latitude weather front and cold seas had altered its tropical characteristics over the weekend. On Saturday and Sunday, Hurricane Dorian struck eastern Canada, causing wind damage and bringing heavy rainfall. According to the Associated Press, a peak of 400,000 people were without power in Nova Scotia, Canada, because of Dorian.
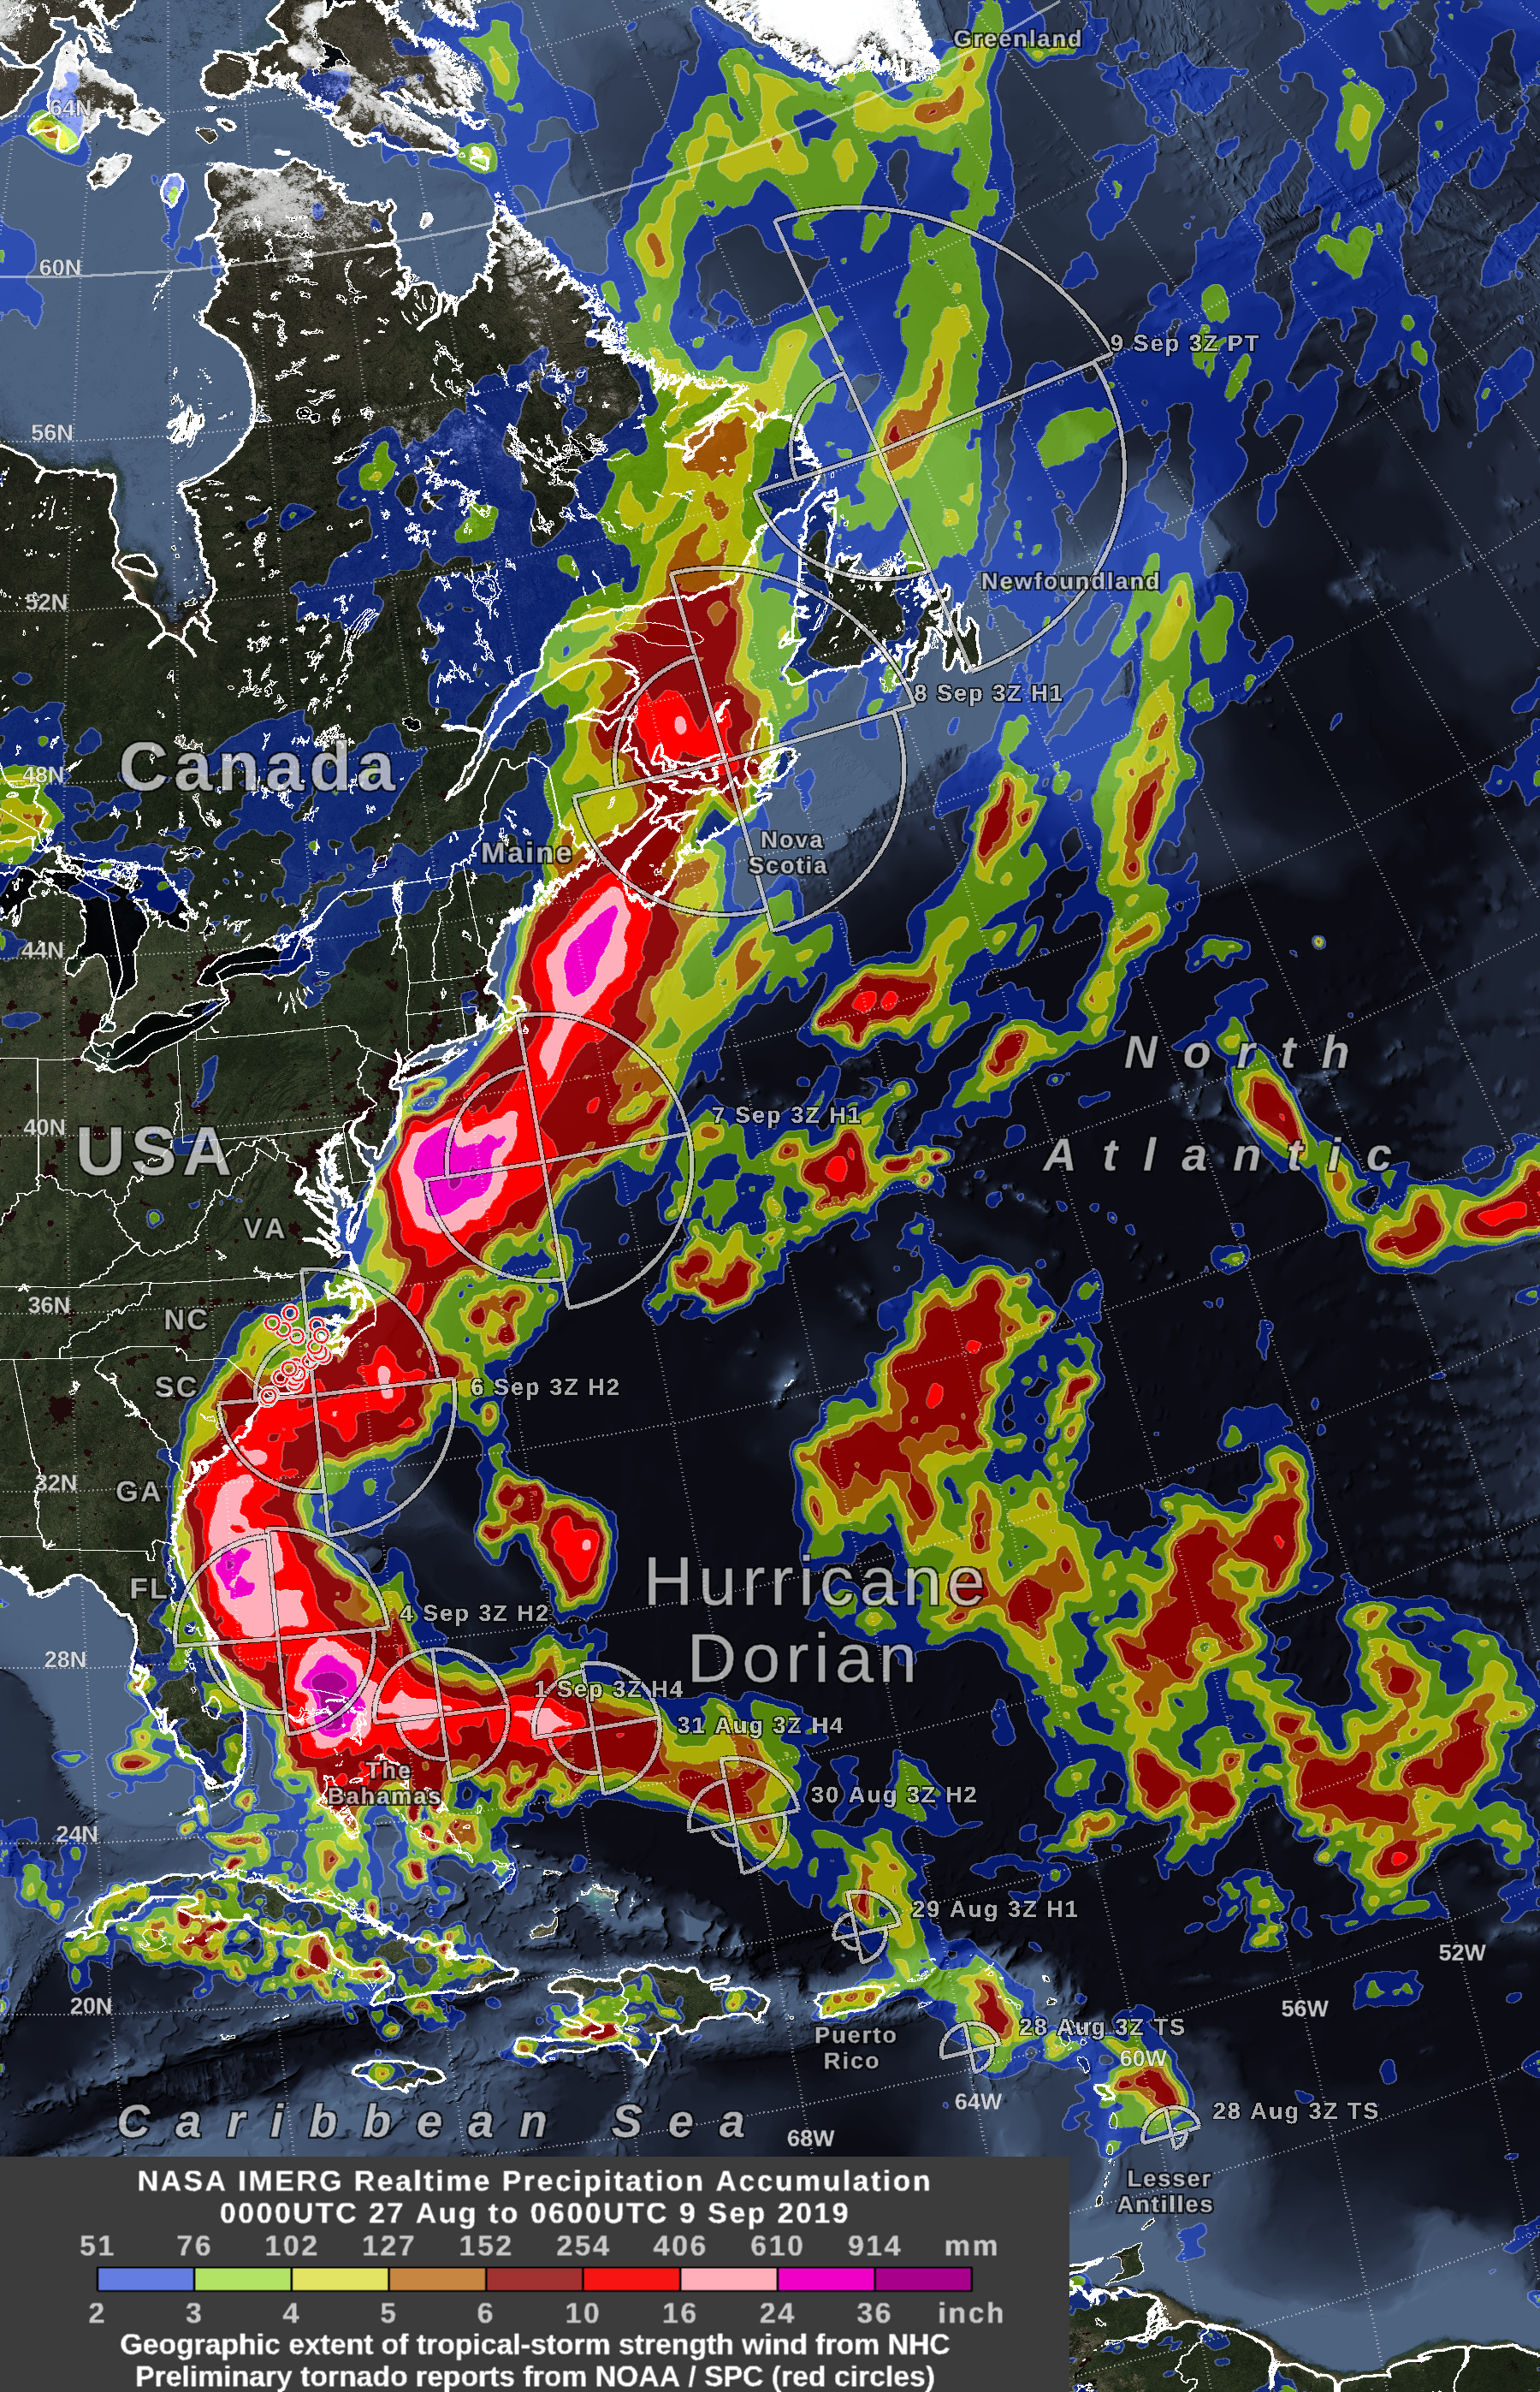
This graphic shows precipitation that fell during the almost two-week period from August 27 to the early hours of September 9. The near-realtime rain estimates come from the NASA's IMERG algorithm, which combines observations from a fleet of satellites, in near-realtime, to provide near-global estimates of precipitation every 30 minutes.
This year, NASA began running a improved version of the IMERG algorithm that does a better job estimating precipitation at high latitudes, specifically north of 60 degrees North latitude. The post-tropical remnant of Hurricane Dorian was approaching this cold region at the end of the period shown in this image. While the IMERG algorithm is still unable to estimate precipitation falling over ice-covered surfaces (such as Greenland), IMERG can now give a more complete picture of the water cycle in places such as Canada, which is, for the most part, free of snow cover at this time of year.
At one-day intervals, the image shows the distance that tropical-storm force (39 mph) winds extended from Hurricane Dorian's low-pressure center, as estimated by the National Hurricane Center. The Saffir-Simpson hurricane-intensity category is the number following the "H" in the label on the image. "TS" or "PT" indicate times when the storm was either at tropical storm strength or when the storm was categorized as post-tropical.
Red circles over North Carolina indicate preliminary reports of tornados from 4:50 AM to 5:00 PM EDT on September 5, provided by NOAA's Storm Prediction Center. Since storm spotters are land based, these reports rarely capture water spouts (tornado-like events over water) that may occur. Lines of latitude and longitude are curved on this map projection, as would be seen by an observer in Earth orbit, so that both tropical and arctic regions can be shown on the same map with minimal distortion. By combining NASA precipitation estimates with other data sources, we can gain a
greater understanding of major storms that effect our planet.
UPDATE 9/5/19:
Hurricane Dorian continues to generate tremendous amounts of rainfall, and has left over three feet of rain in some areas of the Bahamas and is now lashing the Carolinas. NASA’s IMERG product provided a look at those rainfall totals.

By September 5, Hurricane Dorian had dumped heavy rain on coastal South Carolina. An even greater accumulation of over 10 inches was occurring off shore along the path of Dorian’s inner core. In part because of Hurricane Dorian’s forward motion during the past two days, the recent rainfall totals have remained below the 36-inch accumulation observed when Dorian was stalled over the Bahamas. The graphic shows the distance that tropical-storm force (39 mph) winds extend from Hurricane Dorian’s low-pressure center as reported by the National Hurricane Center. The Saffir-Simpson intensity category is the number following the “H” in the label on the image.
By Thursday morning, September 5, Hurricane Dorian had dumped heavy rain on coastal South Carolina. An even greater accumulation of over 10 inches was occurring off shore along the path of Dorian’s inner core. In part because of Hurricane Dorian’s forward motion during the past two days, the recent rainfall totals have remained below the 36-inch accumulation observed when Dorian was stalled over the Bahamas.
NASA has the ability to estimate the rainfall rates occurring in a storm or how much rain has fallen. Rainfall imagery was generated using the Integrated Multi-satEllite Retrievals for GPM or IMERG product at NASA’s Goddard Space Flight Center in Greenbelt, Maryland. These near-realtime rain estimates come from the NASA IMERG algorithm, which combines observations from a fleet of satellites in the GPM or Global Precipitation Measurement mission constellation of satellites, and is calibrated with measurements from the GPM Core Observatory as well as rain gauge networks around the world. The measurements are done in near-real time, to provide global estimates of precipitation every 30 minutes.
The storm-total rainfall at a particular location varies with the forward speed of the hurricane, with the size of the hurricane’s wind field, and with how vigorous the updrafts are inside the hurricane.
Image Credit: Owen Kelley (NASA GSFC)
UPDATE 9/3/19:
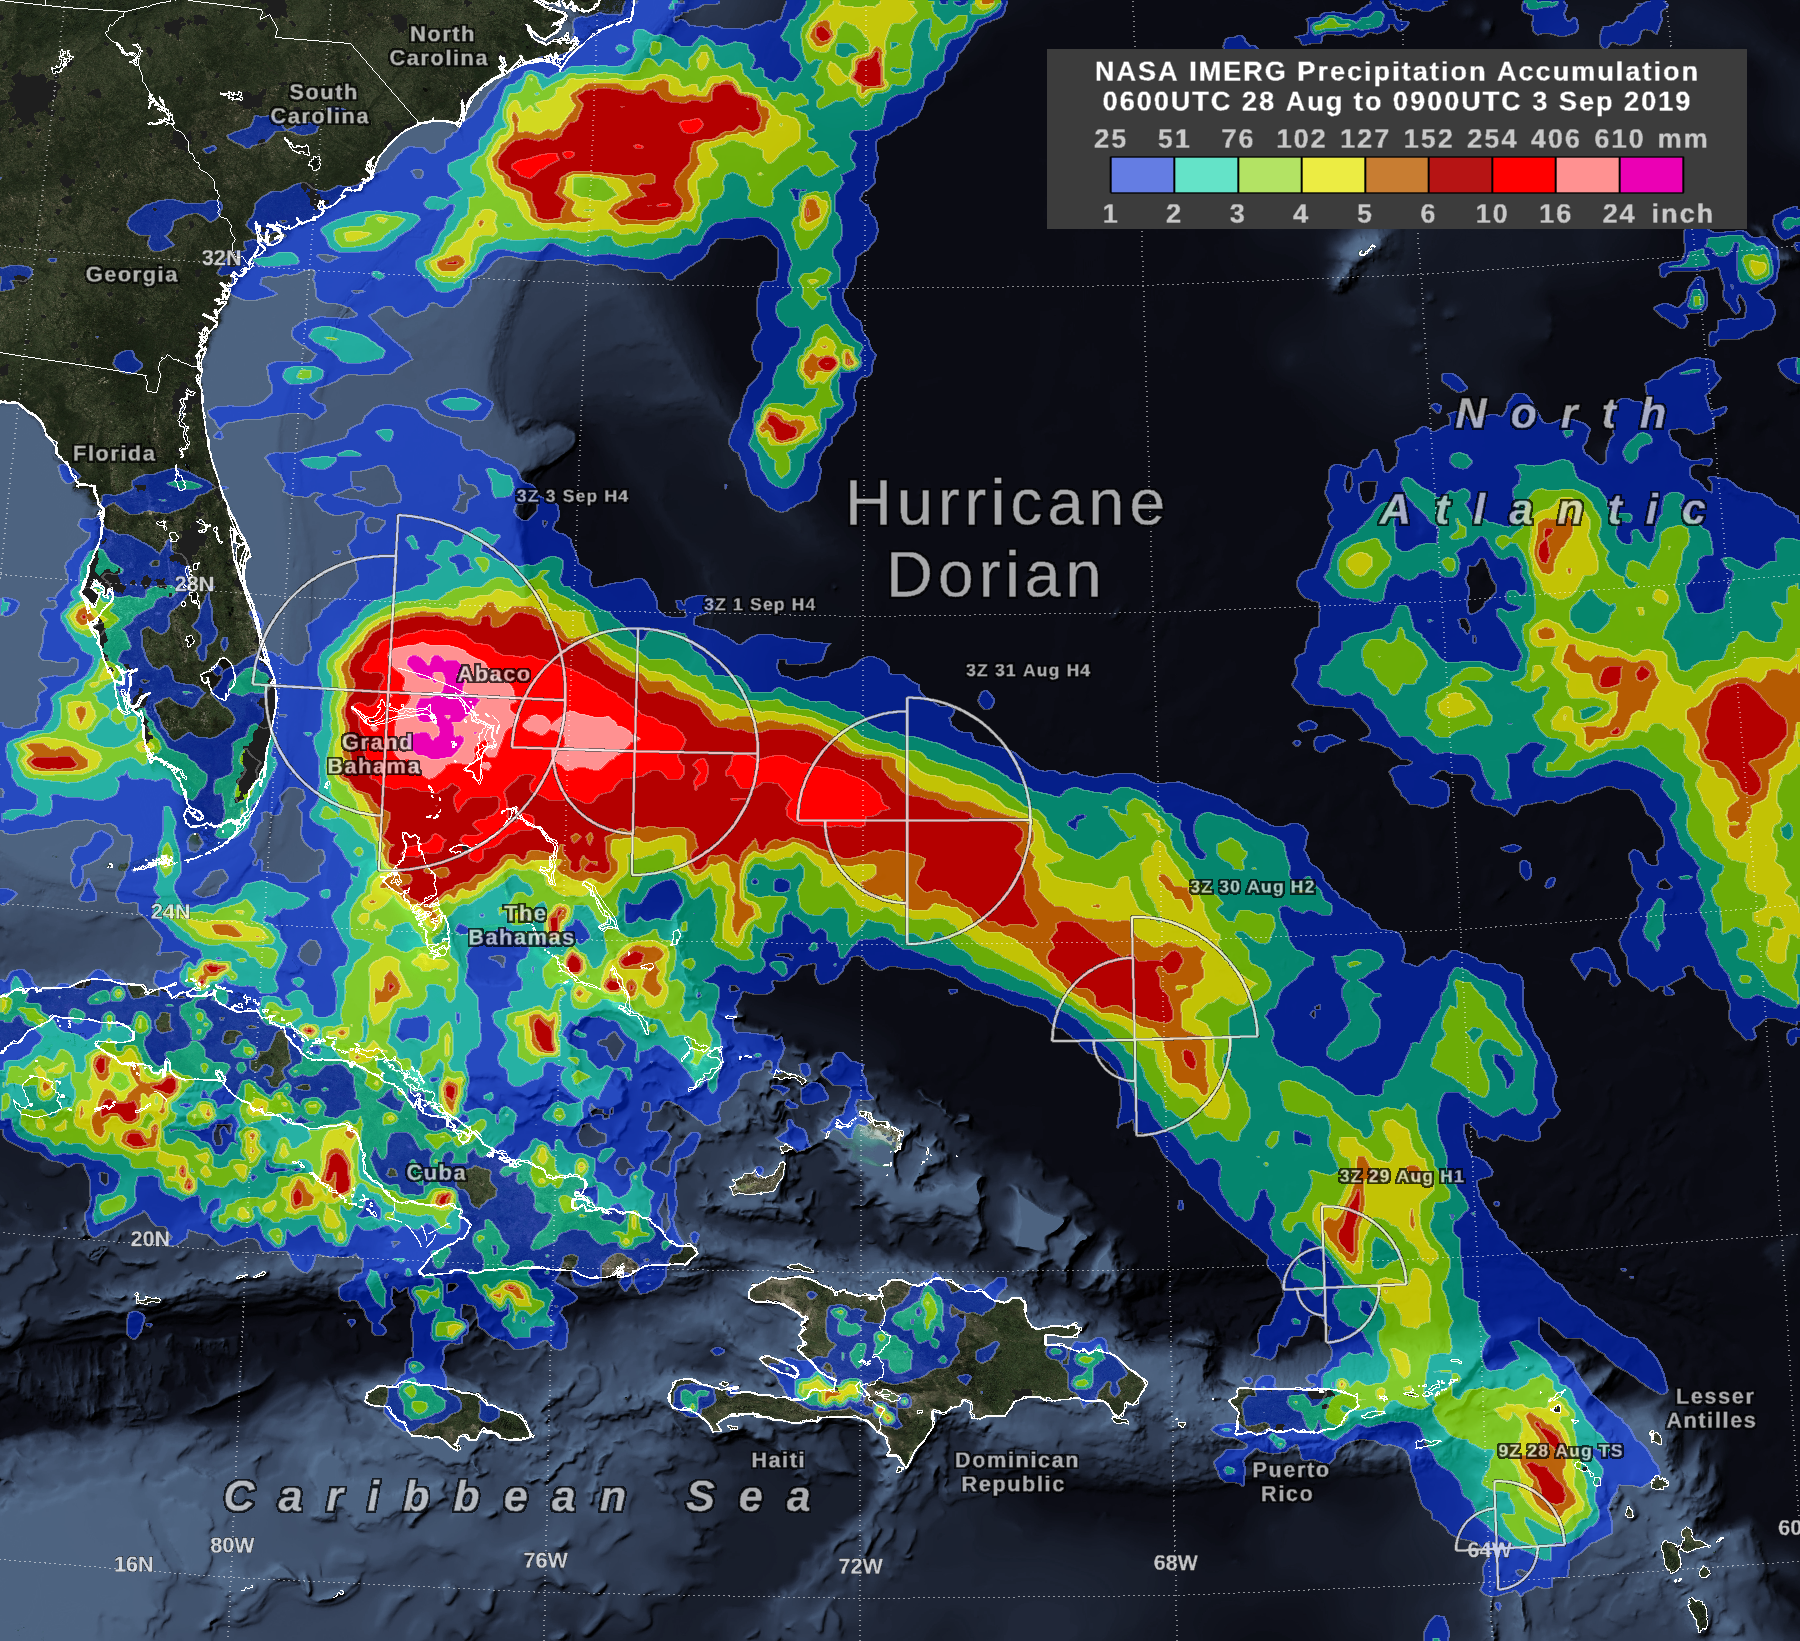
GPM IMERG rainfall accumulation for Hurricane Dorian from August 28th to September 3rd, 2019. Credit: Owen Kelley (NASA GSFC)
In the early hours of Tuesday, September 3, Hurricane Dorian had been stationary over the island of Grand Bahama for 18 hours, most of the time as a category 5 hurricane. Storm-total rain accumulation over parts of Grand Bahama and Abaco Islands have exceeded 24 inches according to NASA satellite-based estimates.
NASA’s IMERG storm-total rain accumulation over parts of Grand Bahama and Abaco islands have exceeded 24 inches according to NASA satellite-based estimates. The graphic also shows the distance that tropical-storm force (39 mph) winds extend from Hurricane Dorian’s low-pressure center, as reported by the National Hurricane Center. The symbols H and TS represent a hurricane of various Saffir-Simpson categories or a tropical storm, respectively.
Get more Hurricane Dorian news and updates at NASA's Hurricane Blog
UPDATE 8/30/19
As Hurricane Dorian was upgraded to a Category 3 hurricane on the Saffir-Simpson Hurricane Wind Scale, NASA’s fleet of satellites were gathering data during the day to assist weather forecasters and scientists. At 2:00 pm EDT the National Hurricane Center (NHC) posted a supplemental advisory. NHC reports that “extremely dangerous Hurricane Dorian poses a significant threat to Florida and the northwestern Bahamas. The Hurricane Hunter plane finds Dorian is now a major hurricane.”
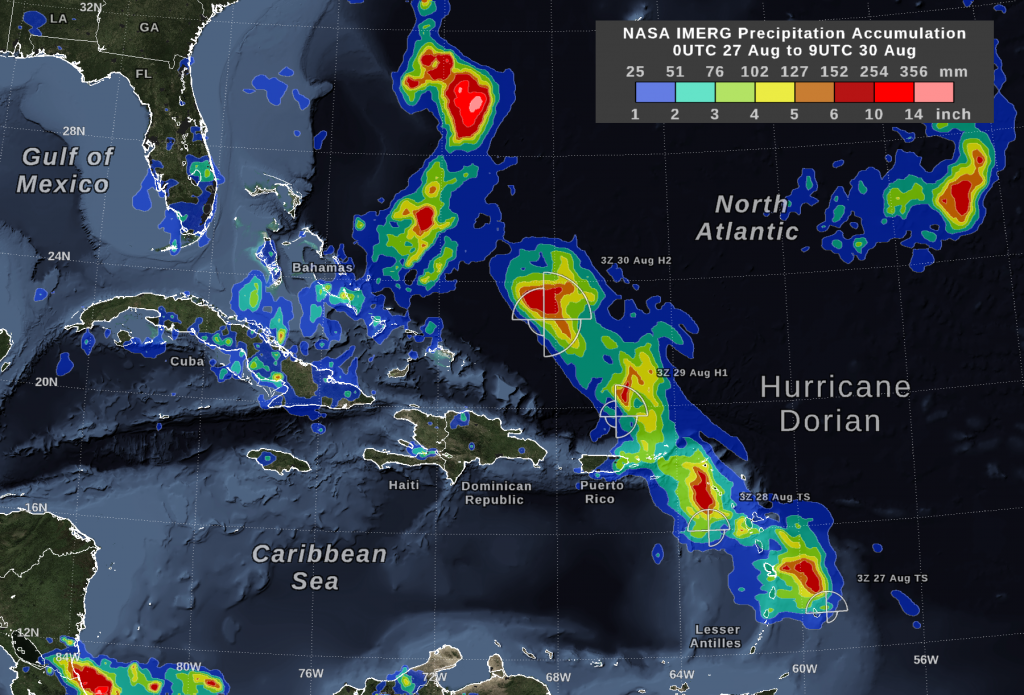
As of early on August 30, Hurricane Dorian has been producing 2 to 6 inches of rain along the path of its inner core for several days. This estimate comes from the NASA IMERG algorithm, which combines observations from a fleet of satellites, in near-realtime, to provide global estimates of precipitation every 30 minutes. The storm-total rainfall at a particular location varies with the forward speed of the hurricane, with the size of the hurricane’s wind field, and with how vigorous the updrafts are in the hurricane’s eyewall. The graphic also shows the distance that tropical-storm force (39 mph) winds extend from the Hurricane Dorians low-pressure center, as reported by the National Hurricane Center. The symbols H2, H1, and TS represent category 2 hurricane, category 1 hurricane, and tropical storm, respectively.
NASA’s Global Precipitation Measurement mission satellite uses its IMERG algorithm with data from a fleet of satellites to provide global estimates of the precipitation within the storm every 30 minutes. This map displays the estimated rainfall accumulation for the region from August 27th - August 30th, prior to Dorian becoming a Category 3 storm.
Get more Hurricane Dorian news and updates at NASA's Hurricane Blog
Image Credit: Owen Kelley (NASA GSFC)
Text Credit: Lynn Jenner (NASA GSFC)