Articles

Using NASA Satellite Data to Predict Malaria Outbreaks
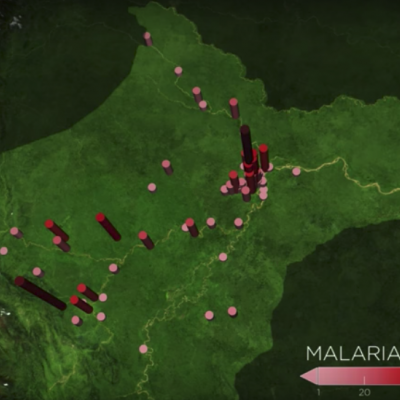
In the Peruvian Amazon, the Anopheles darlingi mosquito is most responsible for spreading malaria. With funding from NASA's Applied Sciences Program, scientists are turning to the agency’s fleet of Earth-observing satellites to develop a system that uses satellite and other data to help forecast malaria outbreaks at the household level months in advance and prevent them from happening. Credits: NASA's Goddard Space Flight Center / Joy Ng In the Amazon Rainforest, few animals are as dangerous to humans as mosquitos that transmit malaria. The tropical disease can bring on high fever, headaches...
GPM Examines Hurricane Irma
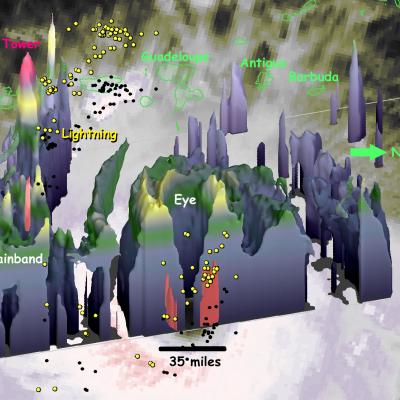
The GPM core observatory satellite had an exceptional view of hurricane Irma's eye when it flew above it on September 5, 2017 at 12:52 PM AST (1652 UTC). This visualization shows a rainfall analysis that was derived from GPM's Microwave Imager (GMI) and Dual-Frequency Precipitation Radar (DPR) data. Irma was approaching the Leeward Islands with maximum sustained winds of about 178 mph (155 kts). This made Irma a dangerous category five hurricane on the Saffir-Simpson hurricane wind scale. Intense rainfall is shown within Irma's nearly circular eye. This 3-D cross-section through Irma's eye was...
Hurricane Irma's Heat Engine Exposed
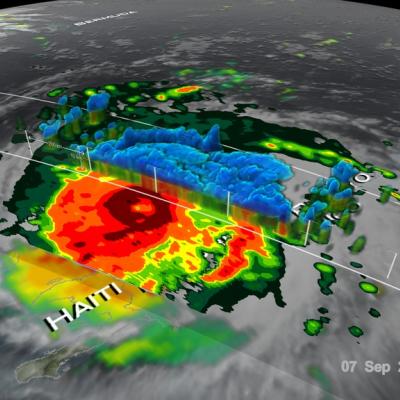
At 1 PM EDT (1700 UTC) on September 5, 2017, the radar on the Global Precipitation Measuring Mission (GPM) satellite captured this 3D view of the heat engine inside of category-5 Hurricane Irma. Under the central ring of clouds that circles the eye, water that had evaporated from the ocean surface condenses, releases heat, and powers the circling winds of the hurricane. The radar on the GPM satellite is able to estimate how much water is falling as precipitation inside of the hurricane, which serves as a guide to how much energy is being released inside the hurricane's central "heat engine."...

GPM Captures Hurricane Harvey's Rainfall
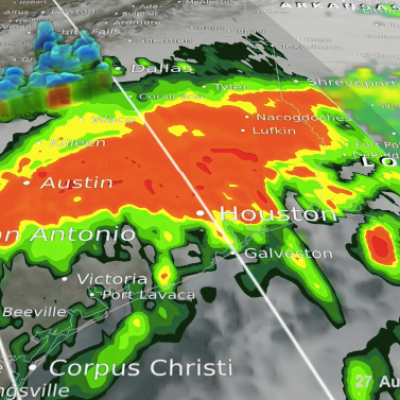
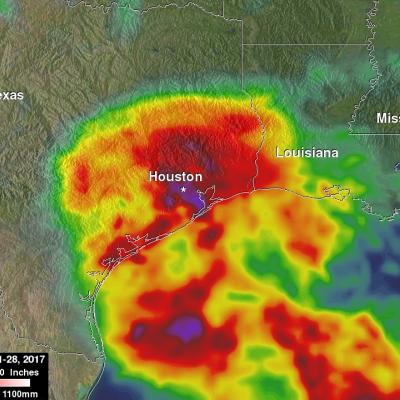
Music: "Whirlpool," Michael Jan Levine, Killer Tracks The Global Precipitation Measurement (GPM) Core Observatory captured these images of Hurricane Harvey at 11:45 UTC and 21:25 UTC on the 27th of August nearly two days after the storm made landfall as it was meandering slowly southeast at just 2 mph (~4 kph) near Victoria, Texas west of Houston. The image shows rain rates derived from GPM's GMI microwave imager (outer swath) and dual-frequency precipitation radar or DPR (inner swath) overlaid on enhanced visible/infrared data from the GOES-East satellite. Harvey's cyclonic circulation is...
Harvey Hits Texas, Unleashes Major Flooding
Despite its earlier demise, after rejuvinating over the warm waters of the Gulf of Mexico, Hurricane Harvey has become a major weather maker as it unleashes historical flooding over parts of coastal Texas. Harvey began on the 17th of August as a weak tropical storm about 250 miles (~400 km) east of Barbados in the Leeward Islands. Over the next two days, Harvey continued moving steadily westward passing through the Leeward Islands as a still weak tropical storm and entered into the east central Caribbean. On the 19th, Harvey succumbed to the effects of northeasterly wind shear over the central...