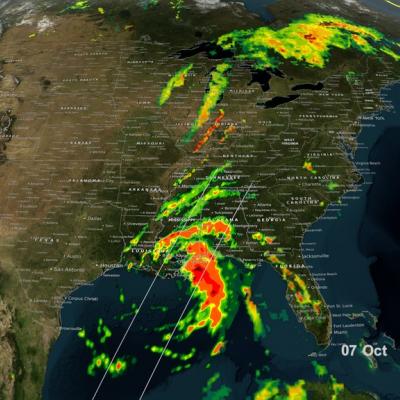
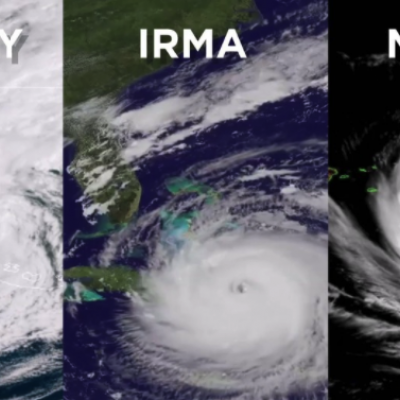
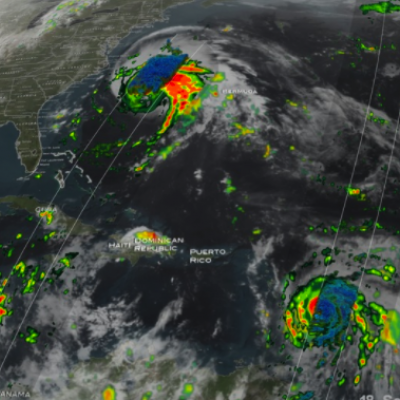
Articles

Harvey Hits Texas, Unleashes Major Flooding
Despite its earlier demise, after rejuvinating over the warm waters of the Gulf of Mexico, Hurricane Harvey has become a major weather maker as it unleashes historical flooding over parts of coastal Texas. Harvey began on the 17th of August as a weak tropical storm about 250 miles (~400 km) east of Barbados in the Leeward Islands. Over the next two days, Harvey continued moving steadily westward passing through the Leeward Islands as a still weak tropical storm and entered into the east central Caribbean. On the 19th, Harvey succumbed to the effects of northeasterly wind shear over the central...
A New Multi-dimensional View of a Hurricane
Download in high resolution from the NASA Goddard Scientific Visualization Studio NASA researchers now can use a combination of satellite observations to re-create multi-dimensional pictures of hurricanes and other major storms in order to study complex atmospheric interactions. In this video, they applied those techniques to Hurricane Matthew. When it occurred in the fall of 2016, Matthew was the first Category 5 Atlantic hurricane in almost ten years. Its torrential rains and winds caused significant damage and loss of life as it coursed through the Caribbean and up along the southern U.S...
GPM Sees Larsen-C Ice Shelf Separation
Click here to download the video (.mp4) On July 12, 2017, a giant iceberg broke off Antarctica and a variety of satellites have been used to study it ever since. The Global Precipitation Measurement (GPM) Microwave Imager (GMI) instrument can see the ribbon of relatively warm water and ice that separates the newly formed iceberg from the its parent mass of ice, the Larsen C ice shelf. While the iceberg is separated from the parent iceshelf by only a few kilometers, the GMI instrument is sensitive enough to detect the variation in temperature between this relatively warm gap and the colder ice...
GPM flying over Earth with a data swath visualized.
Example ESRI map:
GPM Catches Nor'easter over New England
At the time of the Global Precipitation Measurement (GPM) Core Observatory overpass (April 1, 2017, 0550 UTC), the storm's center of low pressure was south of Long Island. At the mid-levels of the atmosphere, the circulation was centered over northeast Pennsylvania. This led to a classic overrunning, warm conveyor setup, which happened when the counterclockwise low level flow drew in cold air out of the north/northeast (hence "Nor'easter") from Canada. Higher up, warm and moist air from further south was lifted over this cold air and resulted in precipitation in the form of snow at the surface...