level 2
The STORM Swath-Based Analysis Tool ( https://storm.pps.eosdis.nasa.gov/storm/Analysis.jsp) is a better way to explore and order targeted Level 2 data. Select one or more instruments from a list going back to the beginning of the TRMM mission, provide a date range, and input a geographic region of interest. Once you hit "Get Granules for Chart," a graph will appear and data points will begin to display. These points represent the mean precipitation rate value for all of the pixels for that orbit of that instrument over that geographic region. Once the graph loading is paused or complete
TRMM Level 2-Level 3 GPROF Processing Announcement
With the completion of the TRMM era GPM constellation version 8 level 1 processing, PPS will start to process the TRMM era MHS, SSMIS, AMSR2 and ATMS version 8 level 2 and level 3 GPROF products on Monday October 16, 2017. Similar to the TRMM version 8 level 1 constellation products, all level 2 and level 3 GPROF products will be produced as GPM version V05, all products are in HDF5 format, all product names will use the GPM file naming convention: https://pps.gsfc.nasa.gov/Documents/FileNamingConventionForPrecipitatio… and the produced data will appear both in STORM
PPS Releases Level 2-Level 3 GPROF MHS Version 04A Data
Level 2 and Level 3 GPROG MHS Version V04A products, starting from February 01, 2014 are in production and will be available to our registered users at: ftp://arthurhou.pps.eosdis.nasa.gov/ This data can also be ordered through PPS's STORM https://storm-pps.gsfc.nasa.gov/storm/ To register with PPS to obtain data, please visit: https://registration.pps.eosdis.nasa.gov/registration/ The DataType designation for these products are as follows: 2AGPROFMETOPAMHS 2AGPROFMETOPBMHS 2AGPROFNOAA18MHS 2AGPROFNOAA19MHS 3GPROFMETOPAMHS_DAY 3GPROFMETOPBMHS_DAY 3GPROFNOAA18MHS_DAY 3GPROFNOAA19MHS_DAY
Level 2 GPM Microwave Imager (GMI) Data Released
The Global Precipitation Measurement (GPM) mission's Precipitation Processing System at NASA’s Goddard Space Flight Center in Greenbelt, Maryland, has released the Level 2 GPM Microwave Imager (GMI) data to the public. The data set includes precipitation rates, which show how much rain and snowfall accumulate over a given time period. This Level 2 data set of falling rain and snow is computed from Level 1 brightness temperature observations from GMI, the basic measurement made by the instrument of naturally occurring energy radiated, in this case, by precipitation particles (raindrops or
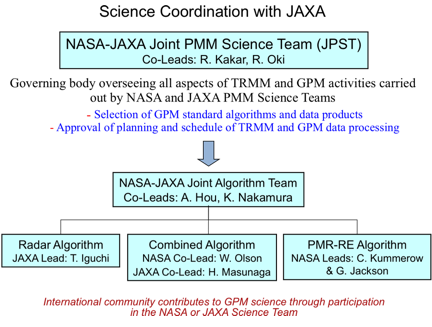
GPM Level 2 Algorithms Organizational Structure

Image Caption
The organizational structure for the Level 2 algorithms.
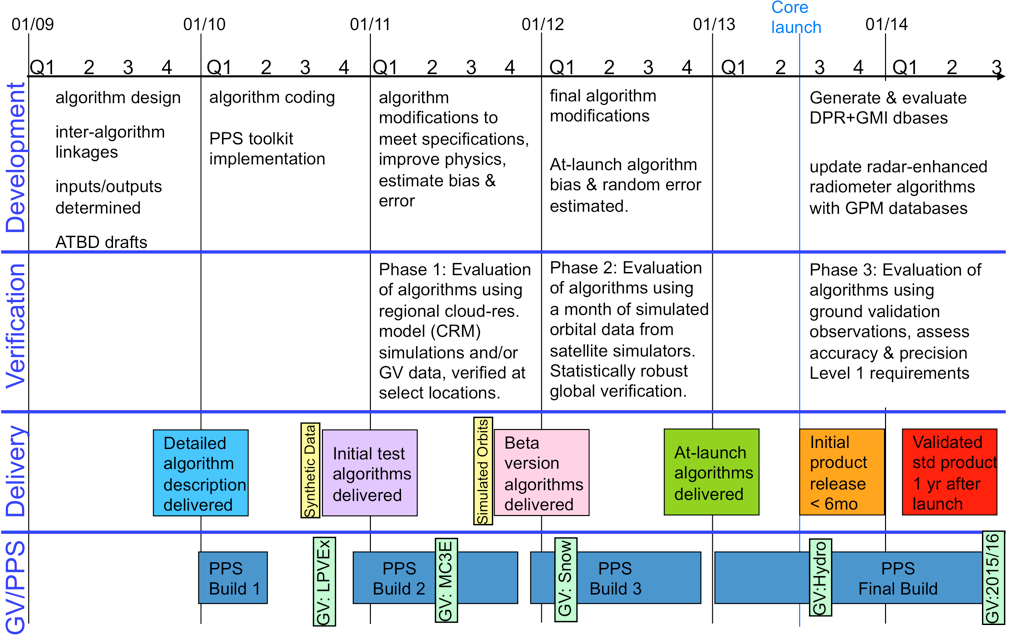
GPM Level 2 Algorithm Development Schedule

Image Caption
The development schedule for the Level 2 algorithms.

