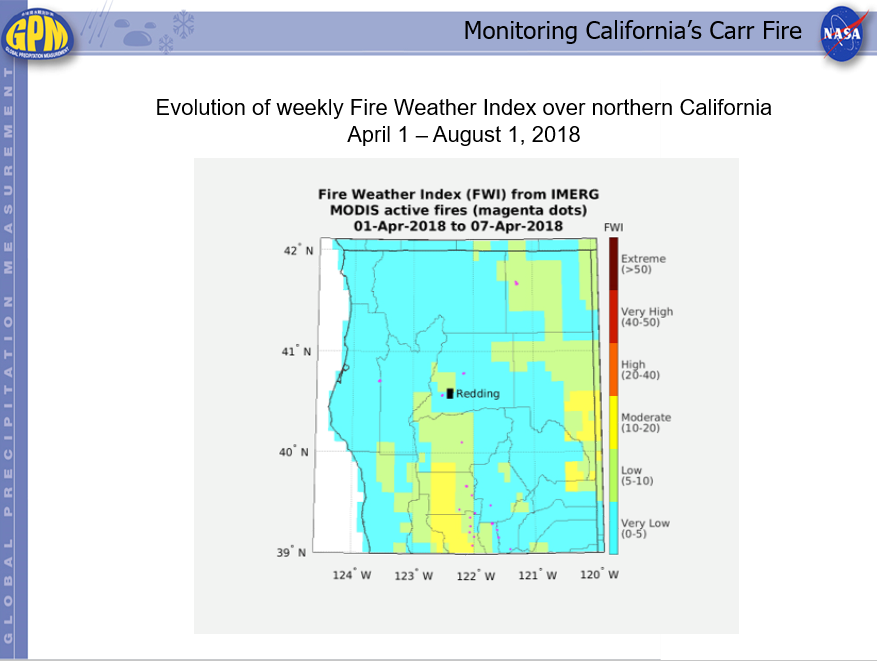
This animation shows the evolution of weekly FWI and MODIS active fires over northern California from April 1 to August 1, 2018. Low FWI conditions were present over the region through April, with a mix of Low/Moderate FWI in May, during which there was only scattered fire activity. The FWI increased steadily during June, and was consistently at Very High or Extreme levels through July. It has remained at Very High/Extreme levels since the start of the Carr fire on July 23rd. The FWI is computed using local 12:00pm surface temperature, relative humidity and wind speed from NASA GMAO’s GEOS-5 model, and daily IMERG total precipitation estimates. Increasing FWI is associated with the potential for higher intensity fires.
Additional Info:
Data are available via the Global Fire Weather Database: https://data.giss.nasa.gov/impacts/gfwed/
FWI categories have been adopted from those of the Global Wildfire Information System (GWIS), which also uses the FWI System for its fire danger products: http://gwis.jrc.ec.europa.eu/about-gwis/technical-background/fire-dange…
For more information, contact Robert Field (robert.field@columbia.edu)