Disasters

Determining where, when, and how natural hazards may vary and affect people at the global scale is fundamental to formulating mitigation strategies, appropriate and timely responses, and robust recovery plans. Specifically, NASA near-real-time precipitation estimates are used for regional assessments of current and potential wildfires and landslide activity.

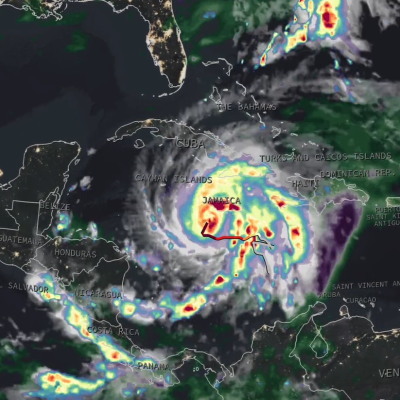
Map IMERG rainfall totals from Milton.
While the GPM Core Observatory’s instruments show exceptional detail in Milton’s rainfall structure in several overpasses throughout the week, the IMERG global multi-satellite product provides a broader overview of precipitation along Milton’s track as a continuous picture from development through landfall. Download this video (right-click -> "save as") The above animation shows IMERG precipitation rates (in blue/yellow shading) and accumulations (in green/purple shading) from Oct. 5-10, 2024. Cloudiness is shown in shades of white/gray using infrared geosynchronous satellite data. While
GPM data shows precipitation within Hurricane Milton over the Gulf of Mexico on Oct. 7, 2024.
Updated Oct. 10, 2024 Click here for a visualization of IMERG precipitations and totals from Hurricane Milton. After forming in the Bay of Campeche, Hurricane Milton underwent a remarkable period of rapid intensification with its central pressure falling from 1007 mb (29.74 inches of mercury, inHg) at 11:00 a.m. EDT Oct. 5 to 897 mb (26.49 inHg) at 8:00 p.m. EDT on Oct. 7. At this time Milton became the fifth most intense hurricane in the Atlantic Basin on record in terms of central pressure, just behind Hurricane Rita (2005) on that list, and only the sixth storm in the Atlantic to have a
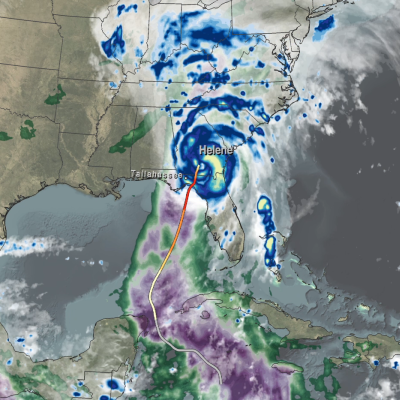
Map of IMERG rainfall totals from Hurricane Helene.
After tracking through the eastern Gulf of Mexico and battering much of the west coast of Florida with strong winds and storm surge, Hurricane Helene made landfall in the Big Bend region of Florida’s northwest coast at 11:10 pm EDT about 10 miles west-southwest of Perry, Florida, as a powerful Category 4 hurricane with maximum sustained winds reported at 140 mph by the National Hurricane Center (NHC). Hurricane Idalia, a strong Category 3 storm at the time, also made landfall in the Big Bend last year. Animation of NASA IMERG precipitation rates and totals from Hurricane Helene from Sept. 23 -
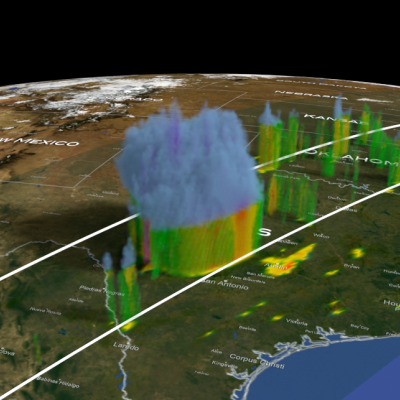
3D map of GPM precipitation estimates from within Hurricane Francine as it approached the Gulf Coast.
Updated: Wednesday, September 18, 2024 Hurricane Francine made landfall on Wednesday, September 11, at 5:00 p.m. CDT on the southern coast of Louisiana, approximately 30 miles south-southwest of Morgan City. The National Hurricane Center (NHC) classified it as a Category 2 storm, with maximum sustained winds estimated at 100 mph. Francine originated from a westward-moving tropical wave of low pressure, known as an African easterly wave. This wave, as is typical, emerged off the west coast of Africa before traversing the tropical Atlantic and Caribbean. These waves often serve as seedlings for
A grid showing many examples of the data GPM has collected in its 10 years of operation.
The joint NASA / JAXA Global Precipitation Measurement (GPM) mission has been tracking rain and snow around the globe for over 10 years, providing valuable insights into Earth's weather and climate. Now in its tenth year of operation, we look at ten events brought to light by this groundbreaking mission.
GPM 10-year banner
Too little or too much precipitation can mean the difference between life and death. Join us as we learn about the impacts of having too much or too little precipitation and the disasters that can occur as a result. Discover what we are learning about the connection between extreme weather events and climate change. Find out the many ways that NASA is helping us monitor and respond to natural hazards and disasters.
IMERG rainfall totals in South Africa, April 5 - 18, 2022.
An upper-level area of low pressure tapped into the warm waters of the South Indian Ocean to bring heavy rains and flooding to parts of South Africa during the second week of April. The event unfolded when an upper-level trough of low pressure embedded within the midlatitude westerlies traversed the southern part of Africa from west to east. As the trough approached the east coast of South Africa, an area of low pressure became detached from the main flow, this “cut off” low then drifted over the warm waters of the Agulhas Current, which channels warmer waters from the tropical Indian Ocean
IMERG rainfall totals from the Nov. 2021 atmospheric river.
The Pacific Northwest coast saw two atmospheric rivers (ARs) bring heavy rains from Nov. 10-16, 2021, resulting in severe flooding, landslides, and damage to infrastructure in the British Columbia province of Canada. ARs are long, narrow corridors of water vapor that travel vast distances above the ocean from warm, tropical regions to higher latitudes, where they often release their moisture as rainfall when they reach land areas. While ARs occur across the globe, this year has been notable for several strong events that have impacted the Pacific Northwest coast. The two atmospheric rivers in
IMERG Rainfall Rates and MUR Sea Surface Temperatures from the 2020 Hurricane Season
Forecasters predicted an above-normal hurricane season for 2020. They weren’t wrong. As the 2020 Atlantic hurricane season smashed records with an unprecedented 30 named storms , NASA’s Earth Applied Sciences Disasters Program stood up to the challenge. The Disasters Program helps leaders and responders at national, regional, and local levels leverage NASA’s technology and expertise to assess, predict, and understand disasters' impacts. The Disasters Program targets a wide range of hazards and disasters , and while NASA is not an operational response agency, the agency offers access to unique
IMERG Total from Cyclone Gati
On November 22, 2020, Cyclone Gati became the strongest storm to hit Somalia since satellite records began five decades ago. Gati made landfall with maximum sustained winds of 170 kilometers (105 miles) per hour, a category 2 storm on the Saffir-Simpson scale . The storm brought more than a year’s worth of rain to the region in two days. Local authorities report at least eight people were killed and thousands have been displaced. The map above shows rainfall accumulation from November 21-23, 2020. These data are remotely-sensed estimates that come from the Integrated Multi-Satellite Retrievals