Tropical Cyclones

GPM Captures Hurricane Harvey's Rainfall
Music: "Whirlpool," Michael Jan Levine, Killer Tracks The Global Precipitation Measurement (GPM) Core Observatory captured these images of Hurricane Harvey at 11:45 UTC and 21:25 UTC on the 27th of August nearly two days after the storm made landfall as it was meandering slowly southeast at just 2 mph (~4 kph) near Victoria, Texas west of Houston. The image shows rain rates derived from GPM's GMI microwave imager (outer swath) and dual-frequency precipitation radar or DPR (inner swath) overlaid on enhanced visible/infrared data from the GOES-East satellite. Harvey's cyclonic circulation is...
A New Multi-dimensional View of a Hurricane
Download in high resolution from the NASA Goddard Scientific Visualization Studio NASA researchers now can use a combination of satellite observations to re-create multi-dimensional pictures of hurricanes and other major storms in order to study complex atmospheric interactions. In this video, they applied those techniques to Hurricane Matthew. When it occurred in the fall of 2016, Matthew was the first Category 5 Atlantic hurricane in almost ten years. Its torrential rains and winds caused significant damage and loss of life as it coursed through the Caribbean and up along the southern U.S...
GPM Measures Tropical Cyclone Debbie
Tropical cyclone Debbie formed in the Coral Sea northeast of Australia om March 24, 2017. Debbie intensified and had hurricane force wind speeds within a day of formation. While headed toward northeastern Australia Debbie reached it's maximum sustained wind speeds estimated at over 100 kts (115 mph) on March 27, 2017 (UTC). Tropical cyclone Debbie came ashore on March 28th and brought destructive winds and extremely heavy rain to northeastern Australia. It was reported that heavy rainfall caused flash flooding that cut off a coastal town and covered several roads in Queensland. The GPM...
GPM Sees Hurricane Matthew Nearing Florida
UPDATE 10/6/16: NASA's Global Precipitation Measurement mission or GPM core observatory satellite flew over Hurricane Matthew several times as the category 4 storm headed toward Florida. The GPM Core Observatory carries two instruments that show the location and intensity of rain and snow, which defines a crucial part of the storm structure – and how it will behave. The GPM Microwave Imager sees through the tops of clouds to observe how much and where precipitation occurs, and the Dual-frequency Precipitation Radar observes precise details of precipitation in 3-dimensions. This data...
NASA Sees Hermine's Twin Towers
In order for Hermine or any other tropical depression, to intensify there must be a pathway for heat energy from the ocean surface to enter the atmosphere. For Hermine, the conduit may have been one of the two "hot towers" that the Global Precipitation Measurement mission or GPM core satellite observed on Aug. 31 at 4:09 p.m. EDT (2009 UTC). GPM's DPR instrument saw strong storms near the center of Tropical Depression Hermine on the evening of Aug. 31. Two "hot towers" are seen to the right of the low pressure center (south and east of the center), which are labeled "T1" and "T2." The "L"...
Creating Digital Hurricanes
Every day, scientists at NASA work on creating better hurricanes – on a computer screen. At NASA’s Goddard Space Flight Center in Greenbelt, Maryland, a team of scientists spends its days incorporating millions of atmospheric observations, sophisticated graphic tools and lines of computer code to create computer models simulating the weather and climate conditions responsible for hurricanes. Scientists use these models to study the complex environment and structure of tropical storms and hurricanes. Getting the simulations right has huge societal implications, which is why one Goddard...
Hurricane Patricia Makes Landfall in Mexico
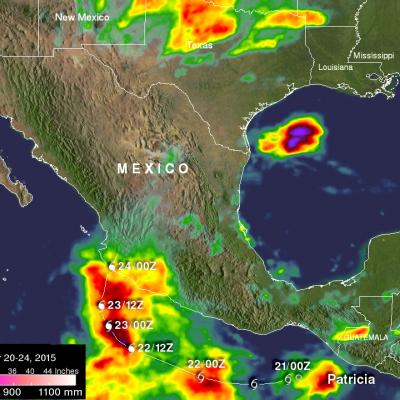
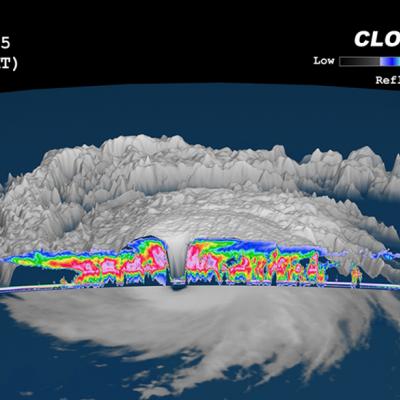
The eye of hurricane Patricia hit the Mexican coast on October 23, 2015 at approximately 6:15 PM CDT(2315 UTC)near Cuixmala, Mexico. The maximum winds at that time were estimated to be 143 kts (165 mph). Patricia is weakening rapidly but continued heavy rain is expected to cause flash floods and mudslides in the Mexican states of Nayarit, Jalisco, Colima, Michoacan and Guerrero through Saturday October 24, 2015. Over the weekend the remants of Patricia are also expected to add to the extreme rainfall in Texas. Rainfall from a stalled front that has been causing flooding in northern and central...
https://www.youtube.com/watch?v=8eIwMXnU8IA&feature=youtu.be
A narrated visualization of Typhoon Kilo. Click here for a full transcript. Click here to download this video in high resolution from the NASA Goddard Scientific Visualization Studio. The Global Precipitation Measurement (GPM) mission core satellite provided many views of Tropical Cyclone Kilo over its very long life. GPM is a satellite co-managed by NASA and the Japan Aerospace Exploration Agency that has the ability to analyze rainfall and cloud heights. GPM was able to provide data on Kilo over its 21 day life-span. The GPM core observatory satellite flew over Kilo on August 25, 2015 at...
How Does NASA Study Hurricanes?
Hurricanes are the most powerful weather event on Earth. NASA’s expertise in space and scientific exploration contributes to essential services provided to the American people by other federal agencies, such as hurricane weather forecasting. The National Oceanic and Atmospheric Administration and the National Hurricane Center (NHC) use a variety of tools to predict these storms’ paths. These scientists need a wealth of data to accurately forecast hurricanes. NASA satellites, computer modeling, instruments, aircraft and field missions contribute to this mix of information to give scientists a...
GPM Sees Tropical Storm Bill Over Texas
Download in hi-res from the NASA Goddard Scientific Visualization Studio Tropical Storm Bill made landfall over Texas at approximately 11:45am CST on June 16, 2015. Shortly after midnight, GPM passed over the storm as it slowly worked it's way northward across the already drenched state of Texas. This visualization shows Bill at precisely 12:11:27am CST (6:11:27 GMT) on June 17, 2015. The GPM Core Observatory carries two instruments that show the location and intensity of rain and snow, which defines a crucial part of the storm structure – and how it will behave. The GPM Microwave Imager sees...