
Disasters

Determining where, when, and how natural hazards may vary and affect people at the global scale is fundamental to formulating mitigation strategies, appropriate and timely responses, and robust recovery plans. Specifically, NASA near-real-time precipitation estimates are used for regional assessments of current and potential wildfires and landslide activity.
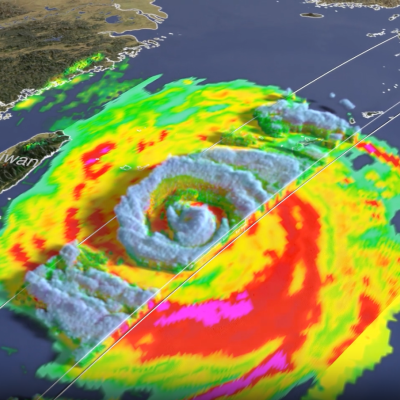
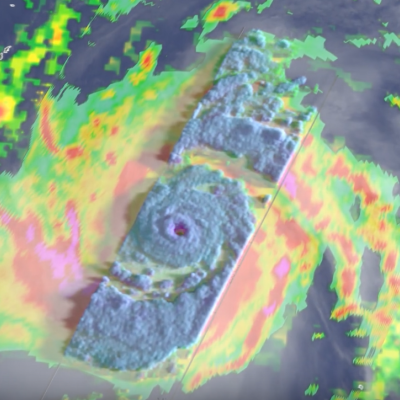
GPM overpass of Super Typhoon Bavi
After rapidly intensifying over the western Pacific, Super Typhoon Bavi became the second super typhoon to strike the Northern Marianas this year, passing over the island chain north of Guam with maximum sustained winds reported at 180 mph by the US Joint Typhoon Warning Center (JTWC). Super Typhoon Sinlaku also hit the islands back in mid-April. Bavi continued on to make landfall in eastern China where it brought heavy rains to the region. Like Typhoon Sinlaku, Bavi began in the West Pacific Ocean between Micronesia and the Marshall Islands from a broad westward-moving area of thunderstorm
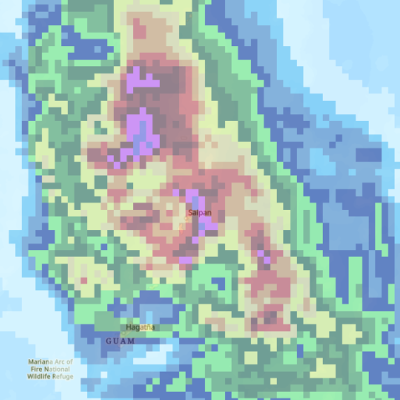
IMERG rainfall data of Typhoon Sinlaku
When Typhoon Sinlaku struck the Northern Mariana Islands and Guam, it disabled ground-based weather radars and rain gauges – the very tools designed to track the storm. As part of the coordinated U.S. response to Sinlaku, the NASA Disasters Program shared IMERG satellite-based observations of rainfall, filling a critical data gap and giving responders a clearer view of the storm’s impacts.
GPM overpass of Typhoon Sinlaku
The GPM Core Observatory flew over the center of Super Typhoon Sinlaku at 12:08 UTC (10:08 pm LST) April 12th, providing a detailed look into the structure and intensity of the precipitation within Sinlaku.
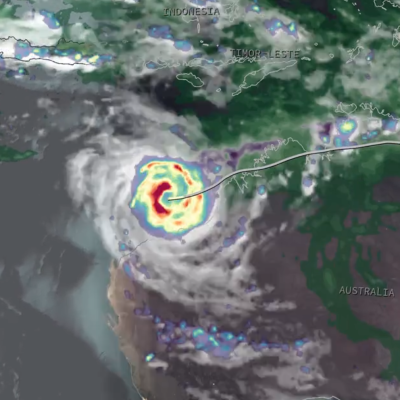
Screenshot of an animation of IMERG precipitation estimates from Tropical Cyclone Narelle in March 2026
After intensifying into a powerful Category 4 cyclone (Category 5 on the Australian scale) in the Coral Sea, Narelle made landfall on the east coast of Queensland, before continuing on across the Northern Territory, and turning south to make landfall yet again in Western Australia. Along the way, Narelle brought gusty winds and heavy rains to all three regions. Narelle first began as a westward-moving area of low pressure south of the Solomon Islands. Warm sea surface temperatures (SSTs), weakening wind shear, and persistent convective activity allowed the circulation to organize such that the
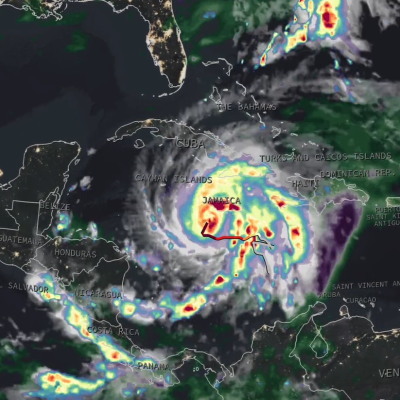
Satellite image of IMERG precipitation rates from Hurricane Melissa over Jamaica.
As Hurricane Melissa passed over Jamaica on Oct. 28, 2025, NASA’s IMERG algorithm provided near real-time estimates of rainfall using data from an international constellation of satellites united by the GPM Core Observatory. The below animation of IMERG precipitation rates and accumulations shows data from Oct. 23 through Oct. 29, revealing that central Jamaica received an estimated 18–24 inches of rain, much of it falling on the 28th. These satellite-based estimates were broadly consistent with the National Hurricane Center’s forecast, which anticipated 20–30 inches of rain due to the storm’s
IMERG Hurricane Harvey (2024) 30-minute summary
NASA's Worldview website now allows you to explore global estimates of rainfall and snowfall from 1998 to the present at 30-minute intervals. Researchers and application developers have been using this dataset since 2014 (Portier 2024; Portier et al. 2023), but now it is also available as images in Worldview.
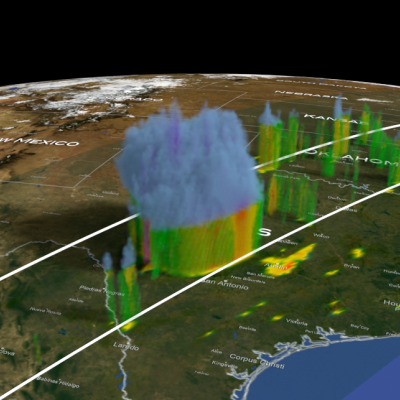
3D view of the Texas storms from the GPM satellite
Over the fourth of July weekend, the Texas Hill Country was devastated by a powerful flash flood event. River levels rose rapidly, on the order of 20 feet or more in 1 to 2 hours or less, all along the upper part of the Guadalupe River. The main flood event started overnight and continued throughout the morning of July 4, resulting in widespread destruction, hundreds of water rescues, many deaths, and numerous people still reported as missing. The Hill Country can be susceptible to flash floods as water tends to run off rather than being absorbed by the soil and plants. The culprit for this
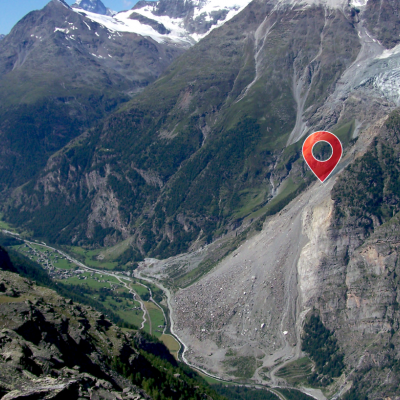
Photograph of a landslide on a mountain.
What was the exact date the landslide occurred? Leave this blank if you are not sure which day it happened. What time did the landslide occur? Enter the approximate time of the landslide in the local time zone. If unknown, leave blank. Where did the landslide happen? This can be a street address, Latitude and Longitude (if known), or general description. Did it cause any damage? How much? Describe any casualties and damage to infrastructure, property, or the environment. Include numbers if possible. How do you know about the landslide? Indicate your source of information, such as personal