Data

GPM Views Southeast Snowstorm

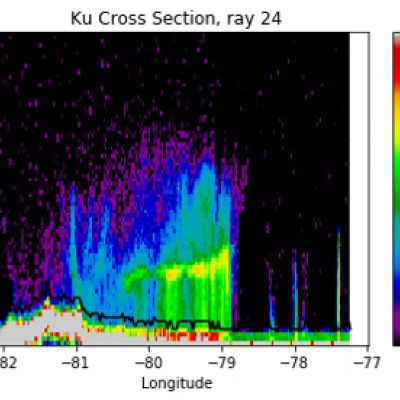
On February 20th and 21st, 2020, a winter storm brought the seasons largest snowfall to much of North Carolina and southern Virginia. The highest snow totals of 3-5 inches (7-12 cm) were located in northeast NC and southeast VA. GPM's radar captured captured the reflectivities shown in this cross-section as it flew over the snow storm on February 20th, with snow and frozen precipitation shown in blue and purple and rain shown in green and yellow. The melting layer marks the transition from snow to rain and slopes upward 2-3 km from central NC to the coast. These raw reflectivity measurements

GPM Measures Heavy Rainfall from "The Dragon" Cyclonic Storm System in the Middle East

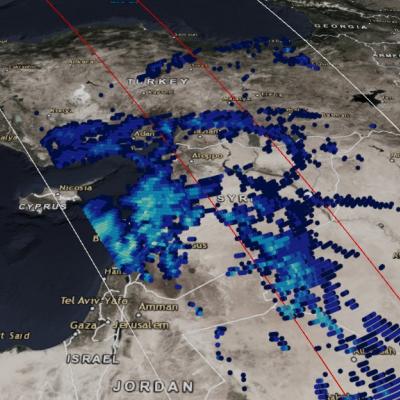
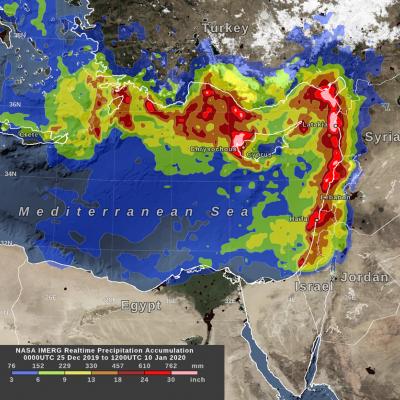
GPM observed the early stages of a strong cyclonic system that developed over northern Africa just off the southern Mediterranean coast on March 11, 2020. The GMI measured heavy rain rates over some parts of Egypt, including the region around Cairo. View fullscreen By March 12, 2020, the cyclonic system that developed over northern Africa had intensified and was nicknamed 'The Dragon' on social media and news outlets, as it caused severe flooding in northern Egypt. Both the GMI and the DPR measured heavy rain rates across two of the storm's bands in this GPM overflight. View fullscreen On

Tropical Storm Imelda Brings Flooding Rain To Texas

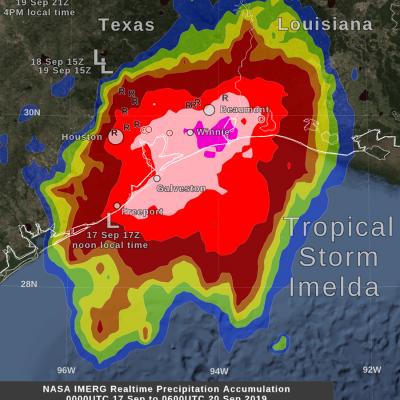
By Friday morning, September 20, the rainfall from the remnant of Tropical Storm Imelda had increased to over 24 inches in some areas near the Gulf of Mexico coast between Beaumont and Houston, Texas. This rainfall was in excess of what had been forecasted a few days earlier and was due to Imelda's forward motion ceasing for approximately 24 hours between Wednesday and Thursday afternoon. The image shows, with large "L" symbols, the location estimated by the National Hurricane Center for Imelda's low-pressure center of rotation at various times over the past three days. This near-realtime rain

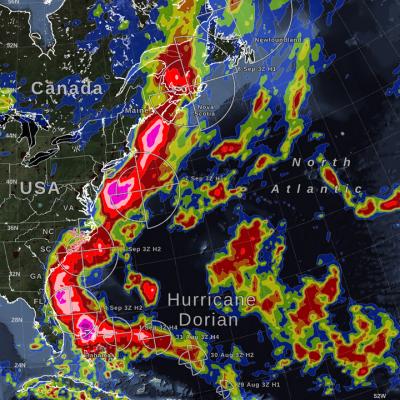
GPM IMERG Measures Hurricane Dorian's Rainfall from the Caribbean to Canada

Hurricane Dorian (2019) brought heavy rain to the Caribbean, along the US East Coast, and up to Canada. NASA satellite-based precipitation estimates tracked the storm throughout its lifetime, as shown by the sequence of images below. September 3, 2019: Hurricane Dorian over Grand Bahama and Abaco Islands In the early hours of Tuesday, September 3, Hurricane Dorian had been stationary over the island of Grand Bahama for 18 hours, most of the time as a category 5 hurricane. Storm-total rain accumulation over parts of Grand Bahama and Abaco islands have exceeded 24 inches according to NASA

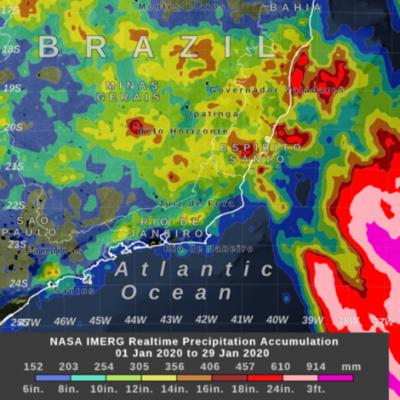
Heavy Rain Leads to Flooding in Brazil

UPDATE 2/12/2020: An extended IMERG analysis of rainfall in Brazil shows even more extreme rainfall occurring in the first weeks of February, with large regions experiencing rainfall totals over 18 inches since the start of 2020. According to local authorities, the region has already received 98% of the rainfall that is typically expected to fall during all of February. UPDATE 1/30/2020: During January 2020, parts of the Brazilian states of Minas Gerais and Espirito Santo experienced above average rainfall, causing deadly floods in the region. Part of the month's heavy rainfall came from a

GPM Flies Over Category 4 Cyclone Harold in the South Pacific

For more information or to download this public domain video, go to: https://svs.gsfc.nasa.gov/4812#29226 UPDATE 4/9/2020 This animation shows the heavy precipitation associated with Tropical Cyclone Harold as it progressed from the Solomon Islands (upper left) on April 2, 2020, explosively intensified on April 3, reached Vanuatu (center) as a Category 4 storm on April 5 before briefly attaining Category 5 status on April 6 and passing just south of Fiji (center right) on April 7 as a Category 4 storm. Periodically, Harold's core region produced precipitation rates in excess of 30 millimeters

GPM IMERG Observes Rainfall from Tornado-spawning Storms in the Southern U.S.

Download video (right-click -> Save As). Credit: Jason West (KBR / NASA GSFC) From Sunday, April 12th, 2020 into Monday the 13th, a series of powerful thunderstorms developed across the southern U.S., bringing heavy rainfall and spawning several destructive tornadoes. This animation shows rainfall estimates for the region for April 11th - 13th derived from NASA's Integrated Multi-satellite Retrievals for GPM (IMERG) data product, along with NOAA tornado reports (red triangles).

GPM Observes Hot Tower in Florida Squall Line

At 9:26pm on Sunday April 19, 2020, NASA's GPM satellite observed an extremely vigorous convective storm cell embedded within a squall line that had produced tornadoes earlier that evening along the US Gulf Coast. NASA's GPM satellite flew over the portion of this squall line that extended over the Atlantic Ocean, 350 miles (500 kilometers) east of Florida's Coast. The Dual-Frequency Precipitation Radar (DPR) observed a storm cell whose updrafts were strong enough to lift small ice particles into the stratosphere 15.8 km above the ocean surface. Equally remarkable is that the updrafts were

Short-lived Bertha Brings Heavy Rains to Parts of Florida

Bertha was a named storm for just the briefest of periods, becoming a tropical storm on the morning of Wednesday May 27th at 8:30 am EDT just one hour before it made landfall along the South Carolina coast near Charleston. After making landfall, Bertha quickly weakened into a tropical depression and was then accelerated northward by the southerly flow between a deep trough of low pressure over the Mississippi Valley to the west and a ridge of high pressure located just off the US East Coast. Because of this, rainfall totals over the Carolina’s were not very heavy. Bertha’s biggest impact actually occurred when it was still in the formation process, before it became organized enough to be named. On Monday May 25th, a trough of low pressure became established over the Florida Straits, initiating shower and thunderstorm activity in the region. Over the next day, as this trough, which extended eastward over the warm waters of the Gulf Stream and eventually led to Bertha, slowly moved northward up the Florida peninsula, it provided a focus for showers and thunderstorms, which brought heavy rains to southeast Florida.