Applications

https://www.youtube.com/watch?v=8eIwMXnU8IA&feature=youtu.be
A narrated visualization of Typhoon Kilo. Click here for a full transcript. Click here to download this video in high resolution from the NASA Goddard Scientific Visualization Studio. The Global Precipitation Measurement (GPM) mission core satellite provided many views of Tropical Cyclone Kilo over its very long life. GPM is a satellite co-managed by NASA and the Japan Aerospace Exploration Agency that has the ability to analyze rainfall and cloud heights. GPM was able to provide data on Kilo over its 21 day life-span. The GPM core observatory satellite flew over Kilo on August 25, 2015 at...
Satellite-Based Flood Monitoring Central to Relief Agencies' Disaster Response
In January 2015, the Shire River in Malawi, and Zambezi River in Mozambique were under tight scrutiny. Weeks of torrential rains led these and other rivers to burst their banks displacing 390,000 people across the region. In southern Malawi 220,000 acres of farmland were turned into a lake, cutting off roads and stranding thousands of people on patches of high ground. The flood was devastating for the country, but within 72 hours of it being declared an emergency the United Nations World Food Programme (WFP) was on the ground distributing food to residents. The quick response was supported by...
Using NASA Data to Show How Raindrops Could Save Rupees
Rainwater could save people in India a bucket of money, according to a new study by scientists looking at NASA satellite data. The study, partially funded by NASA’s Precipitation Measurement Missions, found that collecting rainwater for vegetable irrigation could reduce water bills, increase caloric intake and even provide a second source of income for people in India. The study, published in the June issue of Urban Water Journal, is based on precipitation data from the Tropical Rainfall Measuring Mission (TRMM), a joint mission between NASA and the Japan Aerospace Exploration Agency, which...
GPM Sees Tropical Storm Bill Over Texas
Download in hi-res from the NASA Goddard Scientific Visualization Studio Tropical Storm Bill made landfall over Texas at approximately 11:45am CST on June 16, 2015. Shortly after midnight, GPM passed over the storm as it slowly worked it's way northward across the already drenched state of Texas. This visualization shows Bill at precisely 12:11:27am CST (6:11:27 GMT) on June 17, 2015. The GPM Core Observatory carries two instruments that show the location and intensity of rain and snow, which defines a crucial part of the storm structure – and how it will behave. The GPM Microwave Imager sees...
3D Views of February Snow Storms from GPM
Download this video in HD formats from NASA Goddard's Scientific Visualization Studio The Global Precipitation Measurement (GPM) Core Observatory captured a 3-D image of a winter storm on Feb. 17, 2015, that left 6 to 12 inches of snow over much of Kentucky, southwestern West Virginia and northwestern North Carolina. The shades of blue indicate rates of snowfall, with more intense snowfall shown in darker blue. Intense rainfall is shown in red. The imagery shows great variation in precipitation types over the southeastern United States. Download this video in HD formats from NASA Goddard's...
Signs of Spring Spring Weather What is spring to you?  Spring around the world March 20 - launch of contest
At 5:05 p.m. EST Monday, Jan. 26, 2015, the Global Precipitation Measurement mission's Core Observatory flew over the Nor'easter that dumped snow on New England. This satellite image shows the rate of rainfall, with low amounts in green and high in red, and snowfall, in blue to purple. The center of the storm, shown in 3-D, was offshore with far reaching bands of snowfall. More intense snow rates are shown in darker blue, which can be seen on the northern edge of the storm. Visible in the 3-D image of the center of the storm are the snowy tops of the clouds in blue and underneath where it...

Southwest Indian Ocean Has Two Tropical Cyclones

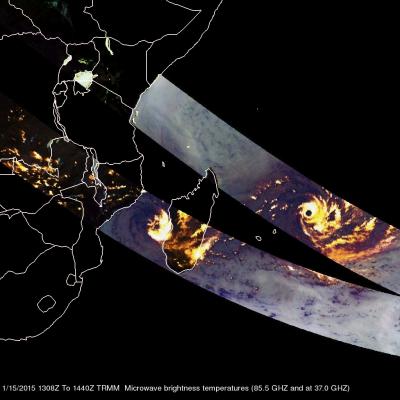
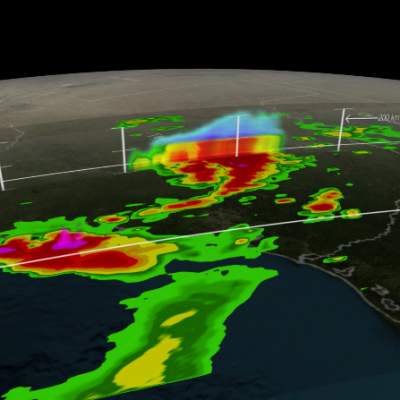
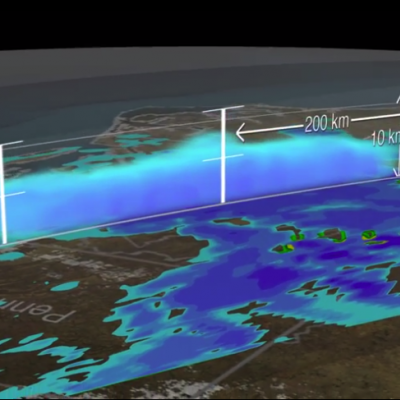
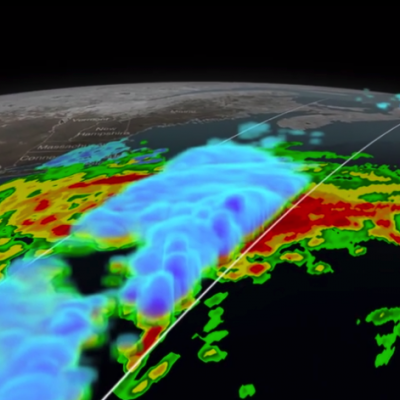
As tropical storm Mekkhala approaches the Philippines in the northern hemisphere tropical cyclone activity in the southeast Indian ocean has recently increased. The TRMM satellite has been monitoring rainfall in the tropics since 1997. On February 15, 2015 the TRMM satellite flew over two tropical cyclones in successive orbits. BANSI 1/15/2015 1308Z CHEDZA 1/15/2015 1440Z Rainfall derived from TRMM's Microwave Imager (TMI) is shown overlaid on a METEOSAT-7 Visble/Infrared images. On January 15, 2015 at 1308 UTC the satellite saw powerful category four tropical cyclone Bansi northeast of the
GPM Dissects Super Typhoon Hagupit
On December 5, 2014 (1032UTC) the Global Precipitation Measurement (GPM) mission's Core Observatory flew over Typhoon Hagupit as it headed towards the Philippines. A few hours later at 1500 UTC (10 a.m. EST), Super Typhoon Hagupit's maximum sustained winds were near 130 knots (149.6 mph/241 kph), down from 150 knots (172 mph/277.8 kph). Typhoon-force winds extend out 40 nautical miles (46 miles/74 km) from the center, while tropical-storm-force winds extend out to 120 miles (138 miles/222 km). Animation revealing a swath of GPM/GMI precipitation rates over Typhoon Hagupit. As the camera moves...
GPM Flies Over Hurricane Gonzalo
Download in Hi-Res from the Scientific Visualization Studio On October 16th, 2014 (1342 UTC) the Global Precipitation Measurement (GPM) mission's Core Observatory flew over Hurricane Gonzalo as it headed towards Bermuda. Hurricane Gonzalo remains a category 4 hurricane on the Saffir-Simpson Hurricane Scale, with maximum sustained winds at 130 mph. As of 12:00 UTC (8:00a.m. EDT) on Friday, October 17th, the National Hurricane Center forecast located the storm about 195 miles south southwest of Bermuda, where a hurricane warning is in effect. The GPM Core Observatory carries two instruments that...
GPM Scans Typhoon Phanfone
Animation revealing a swath of GPM/GMI precipitation rates over Typhoon Phanfone. The camera then moves down closer to the storm to reveal DPR's volumetric view of Phanphone. A slicing plane dissects the Typhoon from south to north and back again, revealing it's inner precipitation rates. Shades of blue indicate frozen precipitation (in the upper atmosphere). Shades of green to red are liquid precipitation which extend down to the ground. Download in Hi-Res from the Scientific Visualization Studio On October 6, 2014 (0215 UTC) the Global Precipitation Measurement (GPM) mission's Core...