
Tropical Cyclones
Constantly scanning the Earth’s surface, the GPM Microwave Imager (GMI) allows scientists to both track tropical cyclones and forecast their progression. Used by NOAA’s National Hurricane Center (NHC), the Joint Typhoon Warning Center (JTWC), and tropical cyclone centers in Japan, India, Australia and other countries, detailed microwave information provides data on the location, pattern and intensity of rainfall.
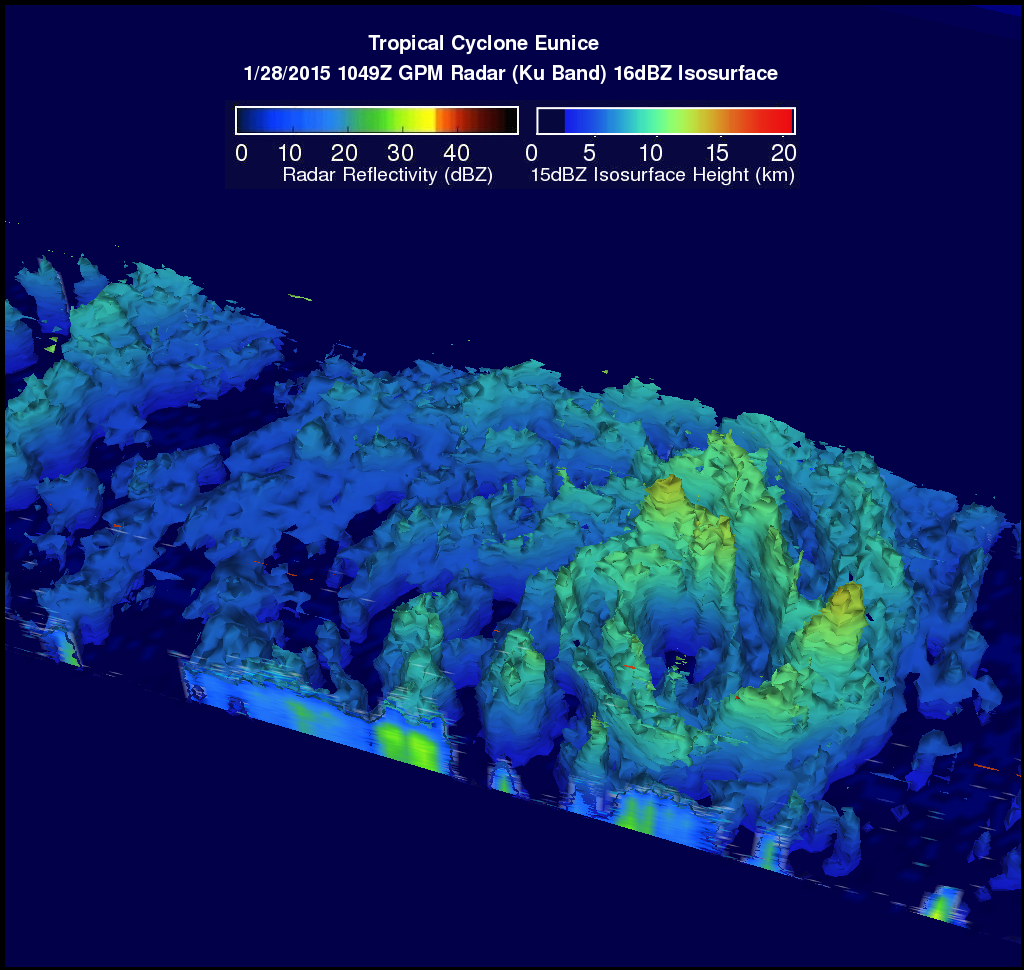 Tropical Cyclone Eunice in the South Indian Ocean on January 28, 2015. GPM's Microwave Imager (GMI) found that rain was falling at a rate of only 30.2 mm (1.2 inches) per hour in storms around Eunice's eye. GPM's Radar (Ku band) was used in a 3-D view to show the vertical structure of the precipitation within the tropical cyclone and showed the highest thunderstorm height was close to 14km (8.7 miles). The storm reached a Category 5 status on the Saffir-Simpson scale on January 30.
Complimenting the GMI is GPM’s Dual-requency Precipitation Radar (DPR), which turns two dimensional images into 3D by providing data on vertical rainfall structure. Scientists use DPR data to verify their tropical cyclone computer models. With the Ku-band and Ka-band, the DPR also measures light rainfall and falling snow, which account for a significant fraction of precipitation especially in middle and high latitudes. They also use the data to understand the distribution and movement of latent heat throughout the storm, particularly in the development of hot towers in the wall of clouds around the eye, which have been linked to rapid intensification. Together, GPM’s GMI and DPR data help scientists establish key characteristics of where, how and why rain falls in tropical cyclones as well as to better understand storm structure, intensity and the environmental conditions that cause them.
The GPM Mission observes tropical cyclone tracking and forecasting capabilities into the middle and high latitudes, covering the area from 65° S to 65°N — from about the Antarctic Circle to the Arctic Circle. This orbit provides new insight into how and why some tropical cyclones intensify and others weaken as they move from tropical to mid-latitude systems. The sensors onboard other satellites within the GPM constellation along with GPM Core Observatory sensors provide the detailed and global observations needed to estimate, monitor and forecast extreme rainfall that may trigger natural hazards, such as flooding or landslides.
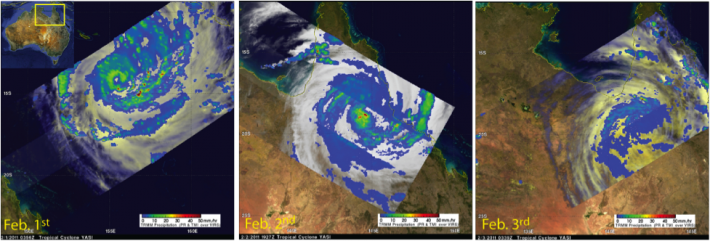
TRMM Satellite image of Tropical Cyclone Yasi on February 1st to 3rd, 2011 (left to right) as it made landfall over Queensland, Australia. TRMM’s PR and TMI instruments observed Cyclone Yasi as it developed from a Category 3 tropical cyclone on Feb. 1st (left), to a Category 5 event when it made landfall with wind gusts reported at up to 186 mph on Feb. 2nd (middle), and then finally as it began to dissipate on Feb. 3rd (right).