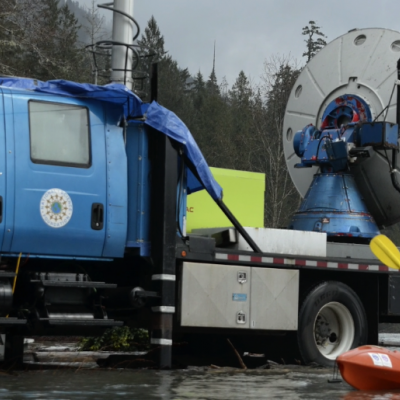
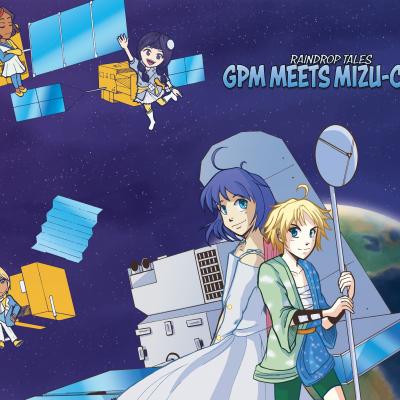
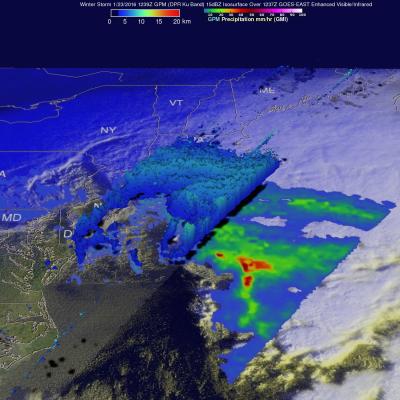
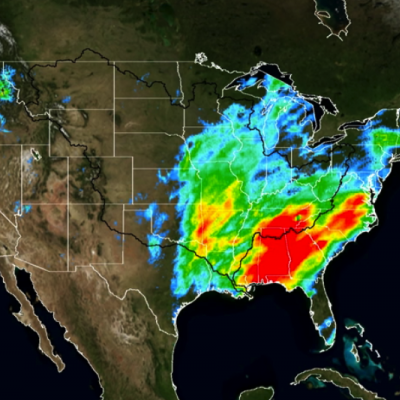
Articles

GPM's First Global Rainfall and Snowfall Map
The Global Precipitation Measurement mission has produced its first global map of rainfall and snowfall. Like a lead violin tuning an orchestra, the GPM Core Observatory – launched one year ago on Feb. 27, 2014, as a collaboration between NASA and the Japan Aerospace Exploration Agency – acts as the standard to unify precipitation measurements from a network of 12 satellites. The result is NASA's Integrated Multi-satellite Retrievals for GPM data product, called IMERG, which combines all of these data from 12 satellites into a single, seamless map. The map covers more of the globe than any...
3D Views of February Snow Storms from GPM
Download this video in HD formats from NASA Goddard's Scientific Visualization Studio The Global Precipitation Measurement (GPM) Core Observatory captured a 3-D image of a winter storm on Feb. 17, 2015, that left 6 to 12 inches of snow over much of Kentucky, southwestern West Virginia and northwestern North Carolina. The shades of blue indicate rates of snowfall, with more intense snowfall shown in darker blue. Intense rainfall is shown in red. The imagery shows great variation in precipitation types over the southeastern United States. Download this video in HD formats from NASA Goddard's...