Articles

Global Precipitation Measurement (GPM) Is In Position to Watch Effects of 2015’s El Niño
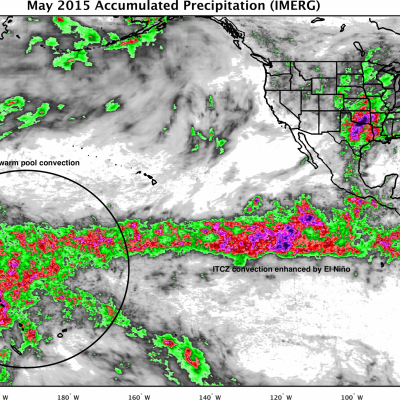
Since late in 2014, scientists in many different disciplines (including meteorologists, climate scientists, physical and biological oceanographers, hydrologists, and geologists) have been watching a slow-to-develop El Niño even in the tropical Pacific Ocean. After teasing observers with conditions that did not quite meet El Niño criteria 1, the event finally reached official El Niño status in March and April, and is now expected to become a powerful event lasting into the next Northern Hemisphere winter. If these conditions, typified by warm sea surface temperatures (SST) in the tropical...

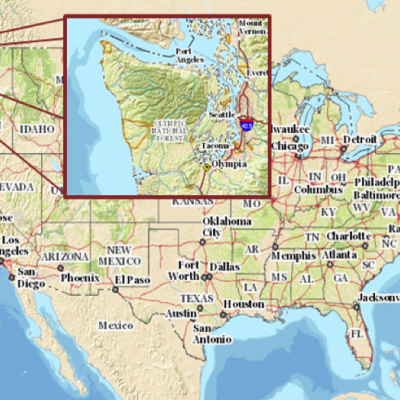
OLYMPEX Field Campaign map
The Olympic Mountain Experiment (OLYMPEX) The Olympic Mountain Experiment, or OLYMPEX, was a NASA-led field campaign, which took place on the Olympic Peninsula of Washington State from November 2015 through February 2016. The goal of the campaign was to collect detailed atmospheric measurements that will be used to evaluate how well rain-observing satellites measure rainfall and snowfall from space. In particular, OLYMPEX assessed satellite measurements made by the Global Precipitation Measurement (GPM) mission Core Observatory, a joint mission by NASA and the Japan Aerospace Exploration...
How Does NASA Study Hurricanes?
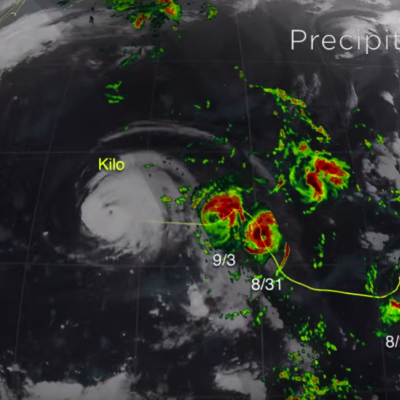
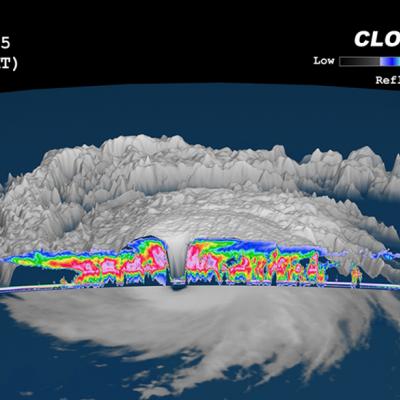
Hurricanes are the most powerful weather event on Earth. NASA’s expertise in space and scientific exploration contributes to essential services provided to the American people by other federal agencies, such as hurricane weather forecasting. The National Oceanic and Atmospheric Administration and the National Hurricane Center (NHC) use a variety of tools to predict these storms’ paths. These scientists need a wealth of data to accurately forecast hurricanes. NASA satellites, computer modeling, instruments, aircraft and field missions contribute to this mix of information to give scientists a...
A Tale of Two Extremes: Rainfall Across the US
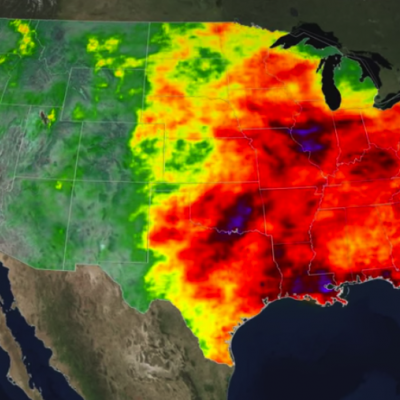
The United States has seen a tale of two extremes this year, with drenching rains in the eastern half of the country and persistent drought in the west. A new visualization of rainfall data collected from space shows the stark contrast between east and west for the first half of 2015. The accumulated precipitation product visualized here begins on Jan. 1, 2015, and runs through July 16, 2015. This visualization shows the heavy rainfall throughout Northern Texas and across Oklahoma as well as the drought in Southern California. Credits: NASA Goddard's Scientific Visualization Studio Download...
California “Rain Debt” Equal to Average Full Year of Precipitation
California's accumulated precipitation “deficit” from 2012 to 2014 shown as a percent change from the 17-year average based on TRMM multi-satellite observations. Credits: NASA/Goddard Scientific Visualization Studio A new NASA study has concluded California accumulated a debt of about 20 inches of precipitation between 2012 and 2015 -- the average amount expected to fall in the state in a single year. The deficit was driven primarily by a lack of air currents moving inland from the Pacific Ocean that are rich in water vapor. In an average year, 20 to 50 percent of California's precipitation...