tropical cyclone

GPM Sees Possible Tropical Cyclone Forming In The Bay Of Bengal

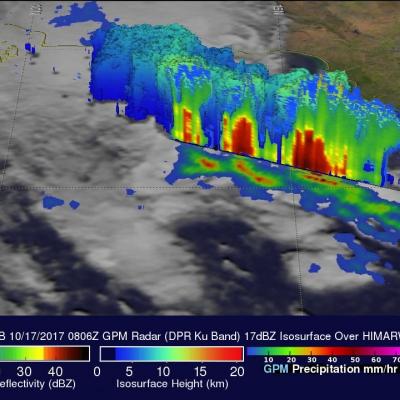
On October 17, 2017 at 0806 UTC the GPM core observatory satellite passed above a low pressure center in the western Bay Of Bengal where a tropical cyclone is probably forming. Warm sea surface temperatures in the Bay Of Bengal are supplying the necessary energy but moderate vertical wind shear observed to the south of the low are counteracting tropical cyclone development. Rainfall rates within the potential tropical cyclone were estimated using data collected by GPM's Microwave Imager (GMI) and Dual-Frequency Precipitation Radar (DPR) instruments. Extremely heavy rainfall accompanied strong

Potential Tropical Development Southeast Of Hawaii

Early this morning at 1100 UTC the TRMM satellite flew above an area where a possible tropical cyclone is developing southeast of the Hawaiian Islands (12 North 140 West). A rainfall analysis from TRMM's Microwave Imager (TMI) and Precipitation Radar (PR) instruments is shown on the left overlaid on a GOES-WEST image received at the exact same time. TRMM PR data found powerful storms near the center of the tropical disturbance where rain was falling at a rate of over 105 mm (about 4.1 inches). Radar reflectivity values of over 50dBZ were being returned to the satellite from intense rain

First Images from GPM

First Images from GPM
Image Caption
The Dual-frequency Precipitation Radar observes rainfall and snowfall that occurs within clouds in three dimensions, across the surface of the Earth and upward into the atmosphere.
An extra-tropical cyclone was observed over the northwest Pacific Ocean off the coast of Japan on March 10, 2014. 
 
The graph on the left shows the extra-tropical storm seen by the DPR as the satellite passed overhead. The x-axis is the east-west longitude and the y-axis is north-south latitude. The colors show the rain rate at sea-level, with more intense rainfall represented by red and lighter precipitation shown in blue.

First Images from GPM Dual-Frequency Precipitation Radar

First Images from GPM Dual-Frequency Precipitation Radar
Image Caption
3D view inside an extra-tropical cyclone observed off the coast of Japan, March 10, 2014, by GPM's Dual-frequency Precipitation Radar.

First data visualization of the three-dimensional structure of precipitation collected by the Dual-frequency Precipitation Radar aboard the Global Precipitation Measurement (GPM) mission's Core Observatory. The image shows rain rates across a vertical cross-section approximately 4.4 miles (7 kilometers) high through an extra-tropical cyclone observed off the coast of Japan on March 10, 2014. The DPR 152-mile (245 kilometers) wide swath is nested within the center of the GPM Microwave Imager's wider observation path.

First Images from GPM Microwave Imager

First Images from GPM Microwave Imager
Image Caption
First Images from GPM Microwave Imager

The image shows rain rates across a 550-mile (885 kilometer) wide swath of an extra-tropical cyclone observed off the coast of Japan on March 10, 2014. Red areas indicate heavy rainfall, while yellow and blue indicate less intense rainfall. In the northwest part of the storm in the upper left of the image, the blue areas indicate falling snow.

Learn More

TRMM Visits Edilson Again

The TRMM satellite had an excellent early morning look at Edilson on February 7, 2014 at 0237 UTC (~ 0628 local time) when it passed directly above the tropical cyclone . A rainfall analysis from TRMM's Microwave Imager (TMI) and Precipitation Radar (PR) instruments is shown overlaid on an enhanced visible/infrared image from TRMM's Visible and InfraRed Scanner (VIRS). The area covered by TRMM's Precipitation radar (PR) data is shown in a lighter shade. Those data show Edilson south of Reunion and Mauritius Islands dropping it's heaviest rain at a rate of over 175mm/hr (~6.9 inches) in an

Tropical Cyclone Mahasen Moving Into The bay Of Bengal

The TRMM satellite again flew almost directly above intensifying tropical cyclone Mahasen (01B) on May 11, 2013 at 2157 UTC. Rainfall data from TRMM's Microwave Imager (TMI) and Precipitation Radar (PR) instruments are shown overlaid on an infrared image from the Visible and InfraRed Scanner (VIRS). TRMM PR data found that the heaviest rainfall was falling at a rate of over 142 mm/hr (~5.6 inches) in a band of powerful storms well to the southwest of Mahasen's center. At the time of this TRMM pass Mahasen's winds were estimated to be about 50kts (~58 mph). Mahasen's winds are predicted to