TRMM Sees Weakening Henriette
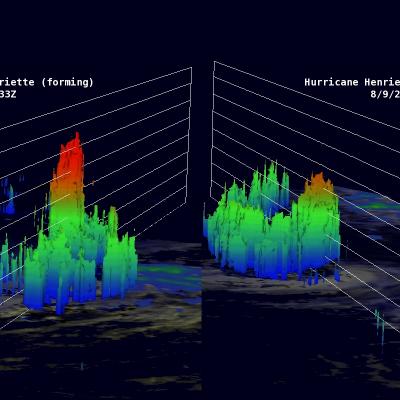
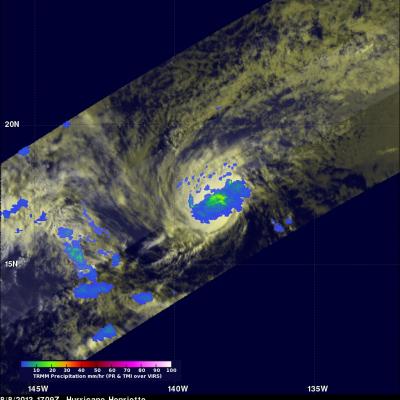
As predicted by the National Hurricane Center (NHC), hurricane Henriette has started a weakening trend. The TRMM satellite flew over Henriette again on August 9, 2013 at 0122 UTC (~ 4 PM local time). The image above shows a comparison between this latest orbit and another visible image from TRMM's previous orbit on August 8, 2013 at 1709 UTC. The eye that was apparent in the previous image was no longer distinct in the latest TRMM pass. The image of the right shows that rain was still falling at a rate of over 161mm/hr (~6.3 inches) near the center of the hurricane. The image above shows a