Tropical Storm Vance Forms
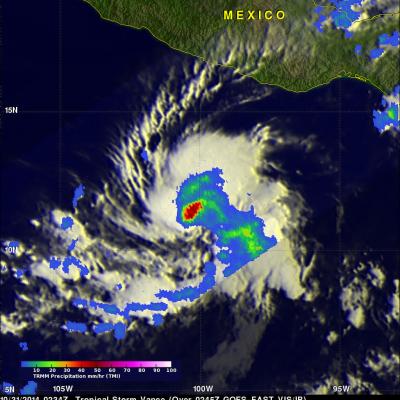
The hurricane season continues to be active in the eastern Pacific Ocean. A Tropical depression south of southern Mexico was upgraded to tropical storm Vance yesterday. The National Hurricane Center (NHC) predicts that Vance will become a hurricane Sunday morning making it the sixteenth hurricane of the 2014 eastern Pacific Ocean hurricane season. TRMM's Microwave imager (TMI) had a good view of the rainfall around tropical storm Vance on October 31, 2014 at 0234 UTC. An analysis of this rainfall is shown overlaid on a 0245 UTC GOES-EAST enhanced infrared image. Intense convective