Deadly Flooding and Landslides With Tropical Storm Jangmi
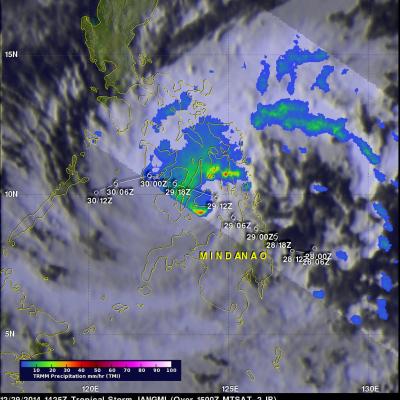
Jangmi became the 23rd named tropical cyclone in the western Pacific Ocean when it formed southeast of the Philippines on December 28, 2014. Heavy rainfall from Tropical storm Jangmi recently produced flooding and landslides in the Philippines that have reportedly killed over 30 people. The Philippines frequently gets hit by tropical cyclones. Tropical storm Jangmi hit only three weeks after slow moving typhoon Hagiput churned through the central Philippines. The TRMM satellite had a fairly good view of Jangmi on December 29, 2014 at 1425 UTC. The TRMM Microwave Imager(TMI) instrument showed