GPM

Content which is affiliated solely with the Global Precipitation Measurement Mission.

Rainfall Floods the Mississippi River
Video Embed
JacobAdmin Thu, 01/14/2016

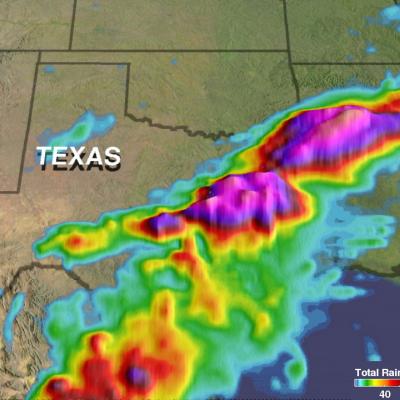
A series of winter storms brought more than 20 inches of rainfall to the Midwest and southeastern United States in December 2015. Massive flooding followed throughout both the regions. An animation of rainfall data from those storms was created at NASA's Goddard Space Flight Center in Greenbelt, Maryland.

Rainfall Floods the Mississippi River
A series of winter storms brought more than 20 inches of rainfall to the Midwest and southeastern United States in December 2015. Massive flooding followed throughout both the regions. An animation of rainfall data from those storms was created at NASA's Goddard Space Flight Center in Greenbelt, Maryland. This animation shows the accumulation of rainfall over the United Stated during December 2015, from the IMERG precipitation dataset. The black outline indicates the Mississippi-Missouri River basin. This version has been edited to only show the periods of significant rainfall during the month...

GPM Views Atlantic Low Monitored By The National Hurricane Center

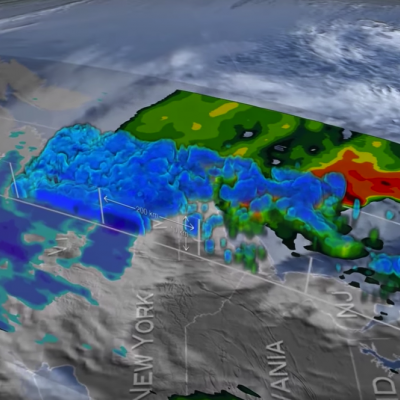
A low pressure center located 1100 miles southwest of the Azores has been monitored by the National Hurricane Center (NHC) for possible development into a non-tropical or tropical storm. This low was producing winds of over 52 kts (60 mph). The Atlantic hurricane season runs from June through November so a tropical storm developing this early in the year would be unusual but not unprecented. The GPM core observatory satellite had an excellent daytime look at this area of disturbed weather on January 13, 2016 at 1201 UTC. GPM's Microwave Imager (GMI) and Dual-Frequency Precipitation Radar (DPR)

GPM Spots Hurricane Pali Forming

Tropical storm Pali intensified late yesterday to become the earliest hurricane ever recorded in the Central Pacific Ocean. Warm ocean waters from El Nino supplied the extra energy needed for Pali to develop and prosper so early in the year. The GPM core observatory satellite flew over Pali on January 11, 2015 at 2121Z. GPM's Dual-Frequency Precipitation Radar (DPR) data sliced through Pali clearly showing that an eye had formed. GPM's DPR measured rain falling at a rate of 84.5 mm (3.3 inches) per hour on the eastern side of Pali's forming eye. GPM's radar (DPR Ku Band) peered through Pali's

GPM 2015: One Year of Storms

Submitted by JacobAdmin on Mon, 01/11/2016
Video Embed

As we enter the new year, take a look back at the snowstorms, tropical storms, typhoons, hurricanes and floods captured and analyzed by the Global Precipitation Measurement (GPM) mission from around the globe during 2015. 

The complete list of storms by date and location are as follows:

1. New England Nor’easter – January 26 – New England, USA
2. Snowstorm – February 17 – Kentucky, Virginia and North Carolina, USA
3. Tornadic Thunderstorms in Midwest – March 25 – Oklahoma and Arkansas, USA

<iframe width="490" height="276" src="https://www.youtube.com/embed/oiGzKmfOvkg?rel=0" frameborder="0" allowfullscreen></iframe>
As we enter the new year, take a look back at the snowstorms, tropical storms, typhoons, hurricanes and floods captured and analyzed by the Global Precipitation Measurement (GPM) mission from around the globe during 2015. The complete list of storms by date and location are as follows: 1. New England Nor’easter – January 26 – New England, USA 2. Snowstorm – February 17 – Kentucky, Virginia and North Carolina, USA 3. Tornadic Thunderstorms in Midwest – March 25 – Oklahoma and Arkansas, USA 4. Typhoon Maysak – March 30 – Yap Islands, Southwest Pacific Ocean 5. Rain Accumulation from Cyclone...

Powerful Tropical Cyclone Ula Monitored By GPM

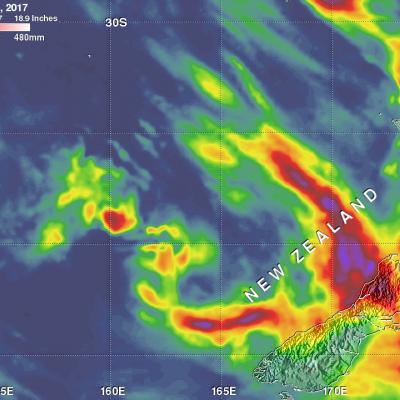
Tropical cyclone ULA's winds peaked at 115 kts (132 mph) over the weekend. These high winds meant that for a couple days ULA was a category four tropical cyclone on the Saffir-Simpson Hurricane Wind Scale. ULA moved over the waters of the North Fiji Basin between the Fiji Islands and New Caledonia before moving southeastward into the South Fiji Basin. The GPM core observatory satellite had good looks at powerful tropical cyclone ULA during it's changes in intensity. On January 8, 2015 at 2216 UTC GPM saw that rain was falling at a rate of over 63.5 mm (2.5 inches) north of the intensifying

GPM Catches Tropical Cyclone Ula Rebounding

Tropical cyclone ULA weakened to tropical storm intensity after passing south of and then to the west of the Fiji Islands in the South Pacific. ULA has now started to intensify again while moving to the southeast of New Caledonia. The GPM core observatory satellite passed above tropical cyclone ULA on January 7, 2016 at 1149 UTC when maximum sustained wind speeds were estimated at 45 kts (52 mph). Rain was measured by GPM's Dual-Frequency Precipitation Radar (DPR) instrument falling at a rate of 68 mm (2.7 inches) per hour in storms on ULA's southern side. Some of these convective storms were

NASA's IMERG Looks At El Nino Storms Hitting California

Extreme rain events fueled by the current strong El Nino have started to affect California. A series of storms over the Pacific are shown transporting rain toward the west coast. This estimate of rainfall totals from December 31, 2015 to January 6, 2016 was made using data from NASA's Integrated Multi-satellitE Retrievals for GPM (IMERG). Global precipitation estimates are provided by IMERG through the use of data from satellites in the GPM Constellation and is calibrated with measurements from the GPM Core Observatory as well as rain gauge networks around the world. The National Weather

3B4x-RT Failure and Backfilling

With the turnover of the year to 2016, the suite of 3B40RT, 3B41RT, and 3B42RT failed to process. Despite the holiday weekend, this was traced to a very old quality control on the date/time, fixed, and retrospectively processed to give a complete time series. Thanks to Erich Stocker and David Bolvin for this effort. The affected date/times are 160101 00UTC through 160102 12UTC.