What is the difference between a tornado and a hurricane?

Both tornadoes and hurricanes are characterized by extremely strong horizontal winds that swirl around their center and by a ring of strong upward motion surrounding downward motion in their center. In both tornadoes and hurricanes, the tangential wind speed far exceeds the speed of radial inflow or of vertical motion.

Hurricanes always and tornadoes usually rotate counterclockwise in the northern hemisphere and clockwise in the southern hemisphere. The Earth's rotation determines this direction for the storms' rotation in each hemisphere. Local winds are sometimes able to cause a tornado to form that spins in the opposite direction from the typical direction for that hemisphere.

The most obvious difference between a tornado and hurricane is that a hurricane's horizontal scale is about a thousand times larger than a tornado. In addition, hurricanes and tornadoes form under different circumstances and have different impacts on the atmosphere.

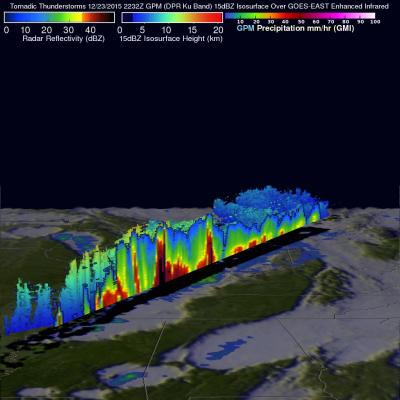
Tornadoes are small-scale circulations, that are rarely more than a few hundred feet across when they touch the ground. Most tornadoes grow out of severe thunderstorms that develop in the high wind-shear environment of the United States Central Plains during spring and early summer.  Many tornadoes form when the large-scale wind flow leads to a violent clash between moist, warm air traveling north from the Gulf of Mexico and cold, dry, continental air coming from the United States Northwest. Tornadoes can also form in many other locations and from other forcing factors. For example, a hurricane making landfall may trigger many tornadoes to form.

Tornado wind speeds may reach 100 to 300 mph and cause havoc on the ground, but tornadoes typically last only a few minutes and rarely travel more than 10 or 20 miles along the ground. Tornadoes have little impact on storms that spawn them or collectively on the global circulation of the atmosphere.

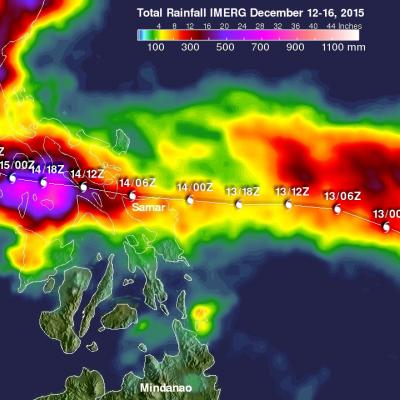
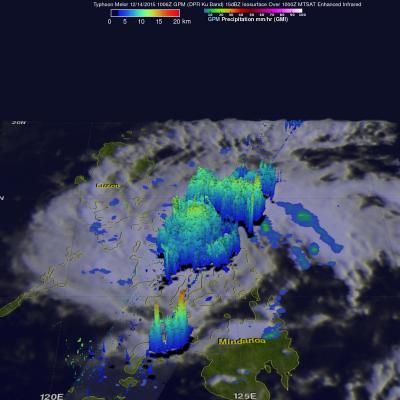
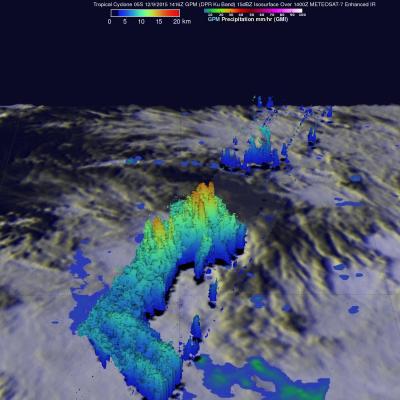
Hurricanes, on the other hand, are large-scale circulations that are 60 to over 1,000 miles across. Hurricanes form near the Equator, generally between 5 and 20 degrees latitude, but never right on the Equator. Hurricanes always form over the warm waters of the tropical oceans and generally where the sea-surface temperature exceeds 26.5°C (76°F).

A hurricane may travel thousands of miles and persist over several days or weeks. During its lifetime, a hurricane will transport a significant amount of heat up from the ocean surface and into the upper troposphere or even lower stratosphere. Even though hurricanes form only sporadically, they do affect the global atmosphere's circulation in measurable ways, although this is still an active area of research.

Extreme Weather News

Jump to a Year

2022 | 2021 | 2020 | 2019 | 2018

2017 | 2016 | 2015 | 2014 | 2013

2012 | 2011 | 2010 | 2009 | 2008

2007 | 2006 | 2005 | 2004 | 2003

2002

NASA's IMERG Adds Up More of Southern India's Extreme Rainfall

Data from the Global Precipitation Measurement or GPM mission core satellite were used to help estimate rainfall data. GPM is a satellite co-managed by both NASA and the Japan Aerospace Exploration Agency. The city of Chennai on India's southeastern coast was hit particularly hard. More than 260 deaths have been reported in the Indian state of Tamil Nadu. Data from NASA's Integrated Multi-satellitE Retrievals for GPM (IMERG) were used to estimate the flooding rainfall that fell from November 28 to Dec. 4, 2015. Over 400 mm (15.7 inches) of rainfall were estimated over areas south of Chennai

Southern India's Catastrophic Flooding Analyzed By IMERG

Extremely heavy rainfall over southeastern India caused deadly flooding in the middle of the month of November. Record setting rainfall has again caused deadly flooding in southern India. The latest deluge started at the end of November 2015 and generated flooding that has resulted in the reported deaths of 188 people. NASA's Integrated Multi-satellite Retrievals for GPM (IMERG) combines all data from 12 satellites into a continuously updated global map of rainfall at half hourly intervals. The rainfall accumulation analysis above was computed from data generated by IMERG during the period

NASA IMERG Data Measures Hurricane Sandra's Rainfall

Data from NASA's Integrated Multi-satellitE Retrievals for GPM (IMERG) were used to estimate the amount of rainfall that hurricane Sandra produced during the period from November 23-29, 2015. Sandra remained well off the Mexican coast during the most dangerous period from November 25-27, 2015 when Sandra was a powerful hurricane with sustained winds of up to 130 kts (150 mph). This analysis shows that much of Sandra's rainfall occurred over the open waters of the Eastern Pacific. This analysis indicates that moisture flowing from hurricane Sandra also caused heavy rainfall totals of over 700

Powerful Hurricane Sandra Viewed By GPM

The GPM core observatory satellite flew above hurricane Sandra on November 26, 2015 at 0706 UTC. Sandra had winds of 125 kts (144 mph) at that time making it a category three on the Saffir-Simpson hurricane wind scale. This means that Sandra is the latest major hurricane ever recorded in the eastern Pacific Ocean. Numerous powerful hurricanes were predicted in the eastern Pacific Ocean at the beginning of the hurricane season due to the development of the 2015 El Nino. Data captured by GPM's Microwave Imager (GMI) and Dual-Frequency Precipitation Radar (DPR) instruments shows rain falling at a

Tropical Storm Sandra

Early this morning tropical Storm Sandra became the 18th named storm of the 2015 Eastern Pacific hurricane season. Intensifying tropical storm Sandra had winds of about 35 kts (40 mph) when the GPM core observatory satellite passed over on November 24, 2015 at 0719 UTC. A rainfall analysis derived using data collected at that time by from GPM's Microwave Imager (GMI) and Dual-Frequency Precipitation Radar (DPR) instruments is shown. DPR discovered that the intense convective storms south of the tropical storm's center of circulation were dropping rain at a rate of over 80 mm (3.1 inches) per