Research Topics
NASA’s Global Precipitation Measurement mission (GPM) develops and deploys advanced space-borne sensors to gain physical insights into precipitation processes and to enable improved monitoring and forecasting of climate, weather and precipitation-related natural hazards. The GPM mission's Core Observatory satellite launched in February 2014 and is currently operational, while its predecessor the Tropical Rainfall Measuring Mission (TRMM) satellite was operational from 1998 to 2015. GPM pursues a unique and innovative approach to measuring precipitation from space through collection of observations by both active and passive sensors, which are then converted into quantitative precipitation estimates. These datasets are used by scientists for analysis and research that leads to new scientific discoveries, and are used by operational agencies for real-time societal applications. The NASA Precipitation Measurement Missions Science Team conducts scientific research on a wide range of areas including precipitation and latent heating algorithm development, ground validation and integrated science applications.
Storm Structure and Mesoscale Dynamics
Seeing Through the Clouds
Conventional weather satellites have the ability to measure visible and infrared light and so can detect and monitor clouds over vast regions, including over oceans and other regions where conventional weather data is sparse, both day and night. They can also be used to quantify their size and coverage as well as estimate cloud heights. However, they still lack the ability to see deep within clouds where the precipitation is; TRMM and GPM changed that. With their active radars, TRMM and GPM gave scientists the ability to examine the detailed precipitation structures of clouds and cloud systems over much of the globe. Foremost among these being tropical cyclones. TRMM and GPM have allowed us to examine the inner structure of a great many storms in relation to their intensity and environment and have strengthened our understanding of hurricane dynamics, in particular the relation between “hot towers” and storm intensification.
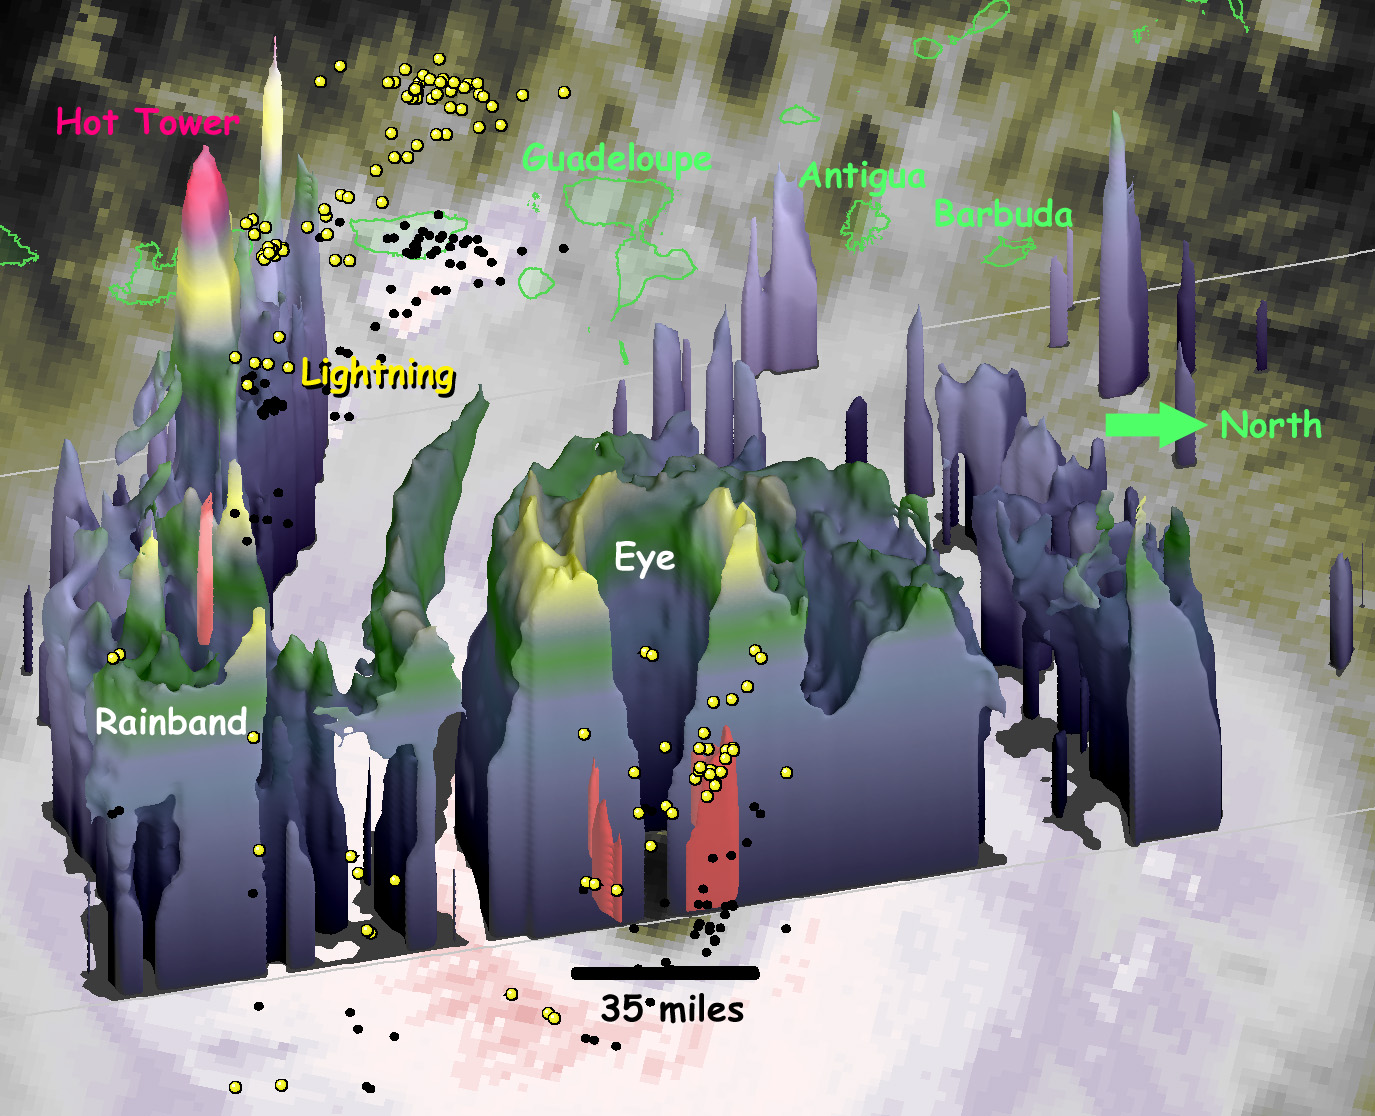
At 1 PM EDT (1700 UTC) on September 5, 2017, the radar onboard the Global Precipitation Measurement mission (GPM) satellite captured this 3D view of the heat engine inside of category-5 Hurricane Irma. Under the central ring of clouds that circles the eye, water that had evaporated from the ocean surface condenses, releases heat, and powers the circling winds of the hurricane. The radar on the GPM satellite is able to estimate how much water is falling as precipitation inside of the hurricane, which serves as a guide to how much energy is being released inside the hurricane's central "heat engine." Learn more. Credit: NASA / Owen Kelley
Another important class of storms are mesoscale convective systems, or MCS's. An MCS is a grouping of thunderstorms ranging in size from tens to several hundred kilometers in length that can last for a few hours or more and propagate over great distances. Typically they contain two distinct regions: a convective region containing heavier precipitation and active thunderstorms, and a sometimes broad stratiform region of lighter more uniform rain. Not only can the rainfall from these systems lead to dangerous flooding over short periods with significant social and economic impacts, but it can also provide an important contribution to the annual rainfall for a given region. Rainfall estimates derived from GPM and TRMM, coupled with the ability to characterize that rainfall have allowed us to quantify the climatological contribution of MCS precipitation to the annual water budget at different scales across the Earth.
TRMM was revolutionary in its ability to observe storms within the tropics. Not only did it provide important information about the structure and intensity of rain storms in the tropics, it filled a critical gap in our observations, namely a comprehensive estimate of the amount and type of rain falling over the global tropics. By linking this rainfall data with the corresponding latent heat released, it also furthered our understanding of how energy moving through the tropics and sub-tropics impacts atmospheric circulations throughout the globe.
The Global Precipitation Measurement (GPM) mission expands our observational capabilities beyond the tropics and subtropics to higher latitudes. GPM gives us the ability to sample a wider variety of storms from not only tropical and subtropical regions but also extratropical and post tropical, including mid and high latitude snow events over both the land and ocean, including those outside the range of conventional radar networks. Just as TRMM gave us a unique perspective for studying tropical cyclones, GPM now brings that same ability to penetrate through the clouds and examine the detailed precipitation structures of higher latitude extratropical storms. GPM maintains the ability to study tropical cyclones and now includes those that transition to post tropical storms beyond the tropics. As with TRMM, GPM allows us to obtain comprehensive precipitation estimates in addition to providing detailed looks at storm precipitation structures and characteristics. With the enhanced sensitivity of its Dual-frequency Precipitation Radar (DPR) allowing us to measure lighter precipitation, GPM allows us to improve these estimates and expand them well beyond the tropics to higher latitudes. This gives us a more complete and accurate description of the Earth’s precipitation budget.
Learn more:
The Global Water Cycle
How Water Moves
The water cycle describes the movement of water over, above and below the Earth’s surface. Water can easily change between any of its three states: vapor, liquid and ice. Its phase transitions among the gaseous, liquid and solid states dominate the behavior of the weather, climate and environmental systems. The way water moves between all three phases is a powerful vehicle for rearranging Earth’s energy budget. In addition, the bulk movement of water by precipitation, infiltration, transpiration, runoff and subsurface flow redistributes water around the globe.
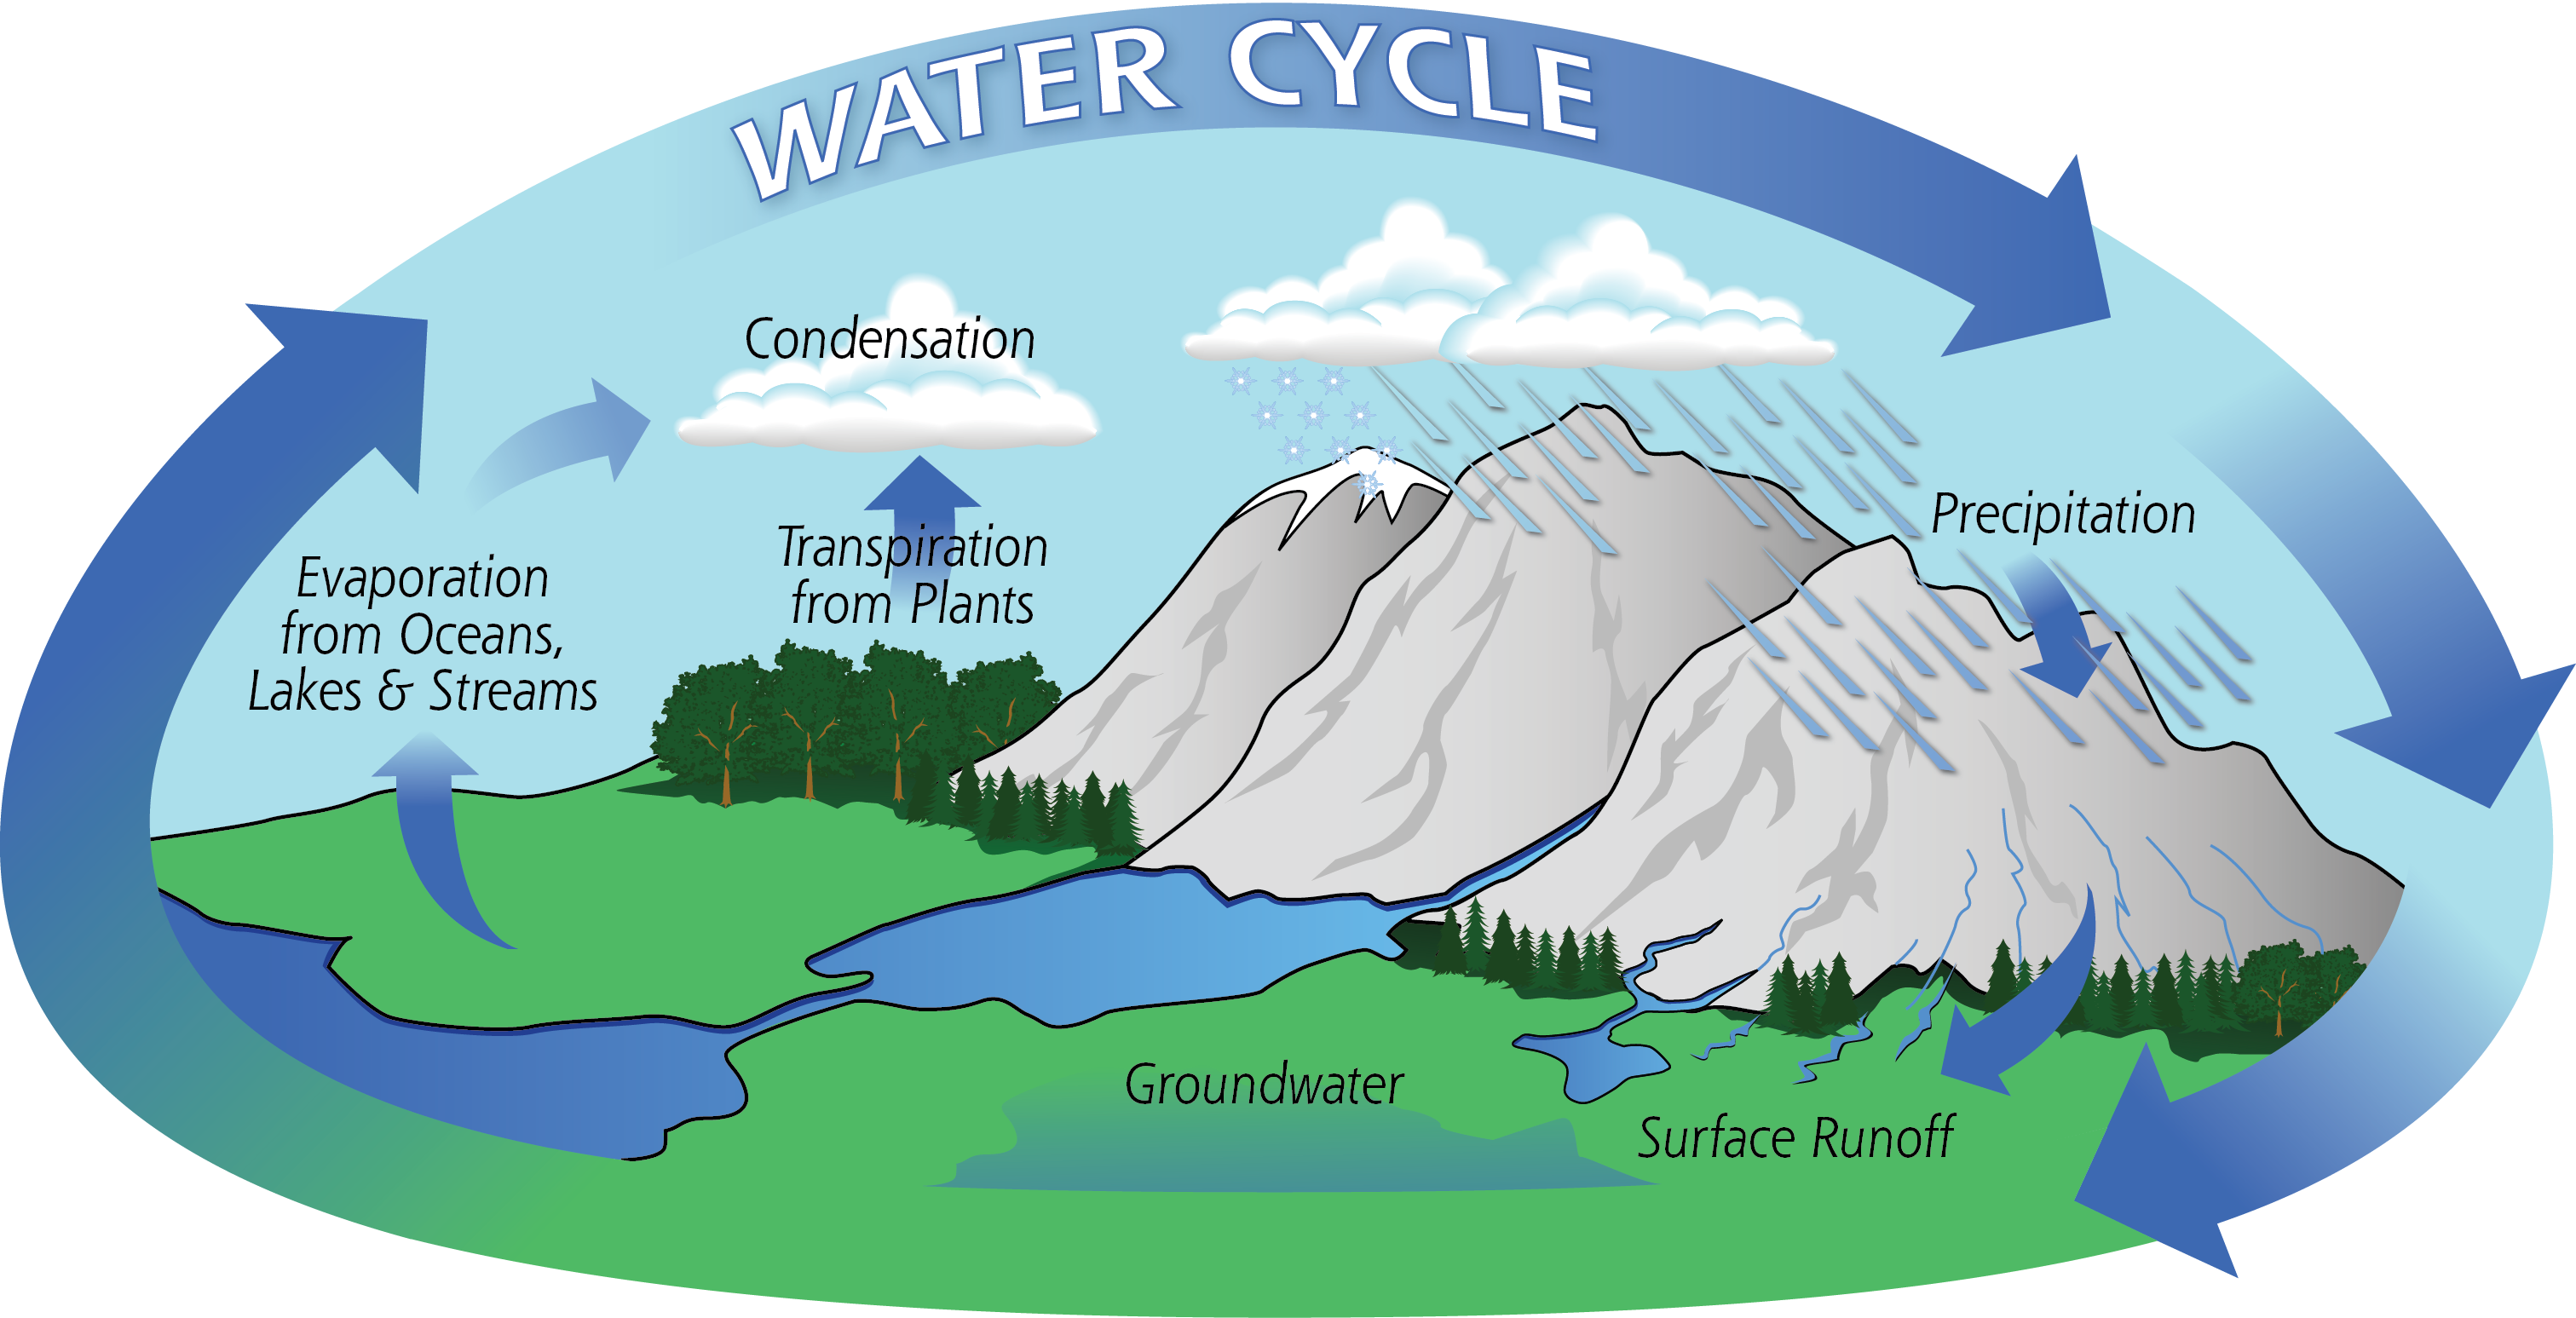
Diagram of Earth's water cycle. Learn more on the Precipitation Education website. Credit: NASA GPM
Key to the connection between water and energy cycles is how the solar radiation affects the atmosphere. The direct contribution from the sun explains only about 25% of the energy in global atmospheric dynamics. The other 75% is transferred to the atmosphere through the evaporation of water from the surface, primarily from the oceans. This water vapor then condenses into clouds and in doing so, releases its latent heat into the atmosphere. This latent heat drives atmospheric circulation, playing a major role not only in cloud formation and storm development, but in the large-scale movement of air around the world. TRMM created the first reliable global latent heating estimates ever made by measuring the profile of rain as it falls through the sky, as a function of altitude.
GPM provides for combined radar / radiometer estimates of both precipitation rates and the 3D characteristics and structure or precipitation. This allows us to estimate the three dimensional latent heating structures of precipitation systems and their microphysics as well as their surface water fluxes. The enhanced measurement and sampling capabilities of GPM help us understand how precipitation patterns change over time across local, regional and global scales. These patterns translate into changes in hydrologic fluxes and states (e.g, runoff, evapotranspiration, soil moisture and groundwater recharge) both directly and in combination with land process models.
By providing more accurate estimates of the rate of transfer of water from the atmosphere to the surface, GPM reduces a significant source of uncertainty in the global water/energy budget. Scientists combine GPM observations with land surface data to provide better estimates of soil moisture, leading to better predictions of vegetation cover, weather forecasts and integrated hydrologic models.
Learn more:
- GPM Applicatinos for Water & Agriculture
- GPM Applications for Ecology
- GPM Applications for Health
- Precipitation Education: The Water Cycle
- Texas A&M Catalog of Precipitation Features
Climate Analysis
Trends & Patterns
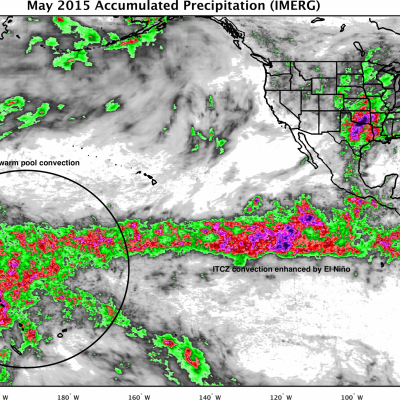
The distribution of the world’s rainfall is shifting as our climate changes. Wet areas may become wetter, dry areas drier, storms more intense, leading to more chaotic weather around the world. According to the Intergovernmental Panel on Climate Change (IPCC, 2011), an increase in the average global temperature is very likely to lead to changes in precipitation and atmospheric moisture, including shifts towards more extreme precipitation during storms.
As the lower atmosphere (the troposphere) becomes warmer, evaporation rates increase, which leads to an increase in the amount of moisture circulating. When the troposphere has more moisture, more intense precipitation occurs, thus potentially triggering more flooding over land. Conversely in other areas, warmer temperatures may lead to increased drying accelerating the onset of drought.
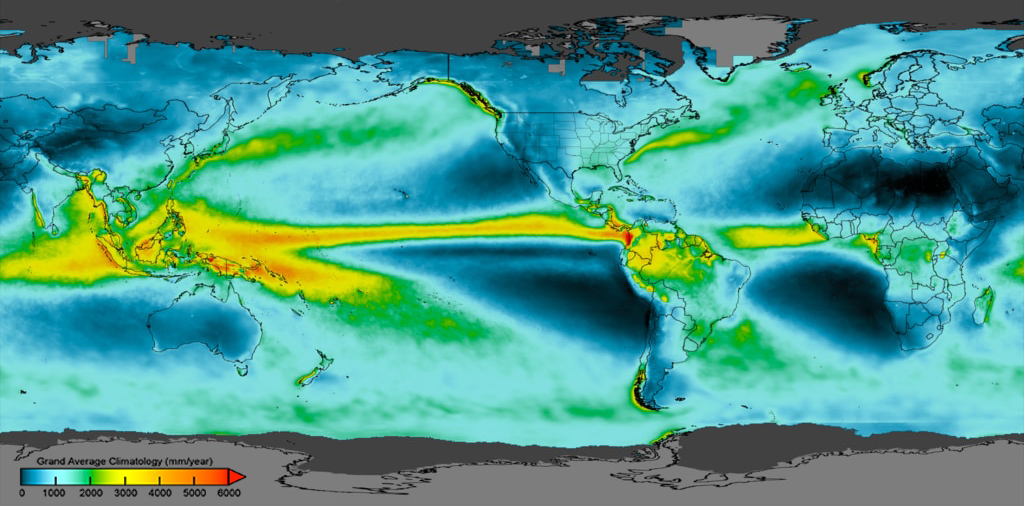
Average annual rainfall (mm/year) for June 2000 - May 2019 computed using the Integrated Multi-satellite Retrievals for GPM (IMERG) "Late Run" data product.
To predict future changes in climate, scientists use very sophisticated computer models that rely on available global data to describe climate as it is today and project how it may behave in the future. The key information offered by both TRMM and GPM helps scientists more accurately estimate the rate of water transfer within the Earth's atmosphere and on the surface. It also reconciles the different parts of the overall water budget. By providing measurements of surface water fluxes, cloud/precipitation microphysics and latent heat release in the atmosphere, GPM advances Earth system modeling and analysis. More accurate global precipitation estimates improve the accuracy and effectiveness of climate models and advance understanding of climate sensitivity and future climatic change.
Learn more:
Precipitation Microphysics
Raindrop Shapes
TRMM’s Precipitation Radar (PR) was the first space-borne radar to observe rain drop characteristics through the atmosphere. These measurements yielded invaluable information on the intensity and distribution of the rain, the type of rain, the height of the storm and the altitude at which falling snow melts into rain. Estimates of the heat released into the atmosphere at different heights based on these measurements are valuable for improving the models used to simulate Earth’s atmospheric circulation.
Not all raindrops are created equal. The size of falling raindrops depends on several factors, including where the cloud producing the drops is located on the globe and where the drops originate in the cloud. For the first time, scientists have three-dimensional snapshots of raindrops and snowflakes around the world from space, thanks to the joint NASA and Japan Aerospace Exploration Agency Global Precipitation Measurement (GPM) mission. With the new global data on raindrop and snowflake sizes this mission provides, scientists can improve rainfall estimates from satellite data and in numerical weather forecast models, helping us better understand and prepare for extreme weather events.
Download this video in high resolution from the NASA Goddard Scientific Visualization Studio
GPM’s Dual-frequency Precipitation Radar (DPR) adds a second frequency to its radar instrument which provides more accurate precipitation information and improves our ability to look at raindrop characteristics, including structure, intensity and related microphysical processes throughout the atmospheric column. Information on the distribution and size of precipitation particles, together with microwave radiometer information, improves the accuracy of rain and snowfall estimates. DPR measurements offer insight into the microphysical processes of precipitation, including evaporation, collision / coalescence and aggregation, among others, and helps to distinguish between regions of rain, snow and sleet. They also allow us to obtain bulk precipitation properties such as intensity, water fluxes and columnar water content. GPM’s advanced instruments significantly improve our ability to detect light rain and falling snow and are helping us investigate potential links between rainfall and human impacts on the environment such as pollution and urban environments.
Learn more: