Disasters

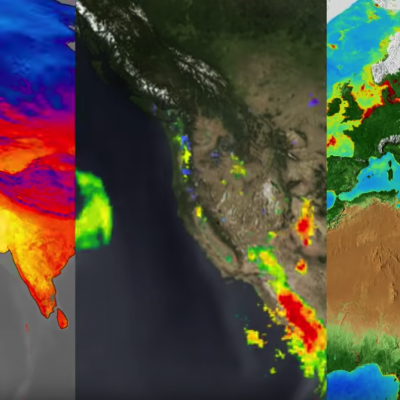
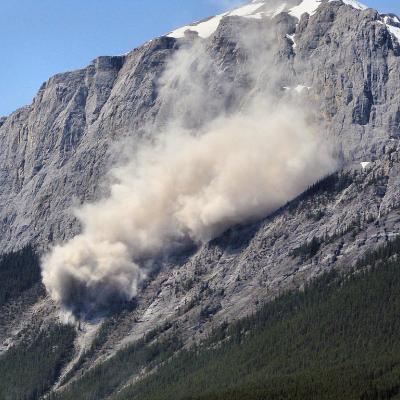
Determining where, when, and how natural hazards may vary and affect people at the global scale is fundamental to formulating mitigation strategies, appropriate and timely responses, and robust recovery plans. Specifically, NASA near-real-time precipitation estimates are used for regional assessments of current and potential wildfires and landslide activity.

Rain Patterns During the Alaska Wildfires
NASA's satellite-based estimate of global precipitation can provide valuable information to officials monitoring the many wildfires in Alaska this summer. Wildfires occur in Alaska each summer, but July 2019 is shaping up to be a particularly active month. Few rain gauges exist in the large tracts of Alaskan wilderness, but wildfires unchecked can spread to populated areas within the state. Satellite-based precipitation estimates are particularly valuable here because of precipitation's relationship to wildfire hazard. The movie shows NASA's IMERG precipitation estimates for May 1 through July...
NASA Rainfall Data and Global Fire Weather
The Global Fire WEather Database (GFWED) integrates different weather factors influencing the likelihood of a vegetation fire starting and spreading. It is based on the Fire Weather Index (FWI) System, which tracks the dryness of three general fuel classes, and the potential behavior of a fire if it were to start. Each day, FWI values are calculated from global weather data, including satellite rainfall data from the Global Precipitation Measurement (GPM) mission.
Help NASA Create the Largest Landslide Database
Landslides cause thousands of deaths and billions of dollars in property damage each year. Surprisingly, very few centralized global landslide databases exist, especially those that are publicly available. Now NASA scientists are working to fill the gap—and they want your help collecting information.
Modeling Landslide Threats in Near Realtime
For the first time, scientists can look at landslide threats anywhere around the world in near real-time, thanks to satellite data and a new model developed by NASA. The model, developed at NASA's Goddard Space Flight Center in Greenbelt, Maryland, estimates potential landslide activity triggered by rainfall. Rainfall is the most widespread trigger of landslides around the world. If conditions beneath Earth's surface are already unstable, heavy rains act as the last straw that causes mud, rocks or debris — or all combined — to move rapidly down mountains and hillsides. A new model has been...
GPM Catches Hurricane Nate's Landfall
NASA's GPM satellite helped track Nate's progress through the Gulf of Mexico and also captured Nate's landfall on the north central Gulf Coast. This animation shows instantaneous rainrate estimates from NASA's Integrated Multi-satellitE Retrievals for GPM or IMERG product over North America and the surrounding waters beginning on Thursday October 5th when Nate first became a tropical storm near the northeast coast of Nicaragua in the western Caribbean until its eventual landfall on the northern Gulf Coast on Sunday October 8th.
Intense Hurricanes Seen From Space
In 2017, we have seen four Atlantic storms rapidly intensify with three of those storms - Hurricane Harvey, Irma and Maria - making landfall. When hurricanes intensify a large amount in a short period, scientists call this process rapid intensification. This is the hardest aspect of a storm to forecast and it can be most critical to people's lives. While any hurricane can threaten lives and cause damage with storm surges, floods, and extreme winds, a rapidly intensifying hurricane can greatly increase these risks while giving populations limited time to prepare and evacuate.
GPM Sees Hurricanes Maria and Jose
GPM passed over both Hurricane Maria and Hurricane Jose on September 18th, 2017. As the camera moves in on the Maria, DPR's volumetric view of the storm is revealed. A slicing plane moves across the volume to display precipitation rates throughout the storm. Shades of green to red represent liquid precipitation extending down to the ground. The Global Precipitation Measurement (GPM) mission shows the rainfall distribution for two major storms churning in the Atlantic and Caribbean basins. The visualization shows Hurricane Jose as it continues to slowly move northward off the US East Coast east...
GPM Examines Hurricane Irma
The GPM core observatory satellite had an exceptional view of hurricane Irma's eye when it flew above it on September 5, 2017 at 12:52 PM AST (1652 UTC). This visualization shows a rainfall analysis that was derived from GPM's Microwave Imager (GMI) and Dual-Frequency Precipitation Radar (DPR) data. Irma was approaching the Leeward Islands with maximum sustained winds of about 178 mph (155 kts). This made Irma a dangerous category five hurricane on the Saffir-Simpson hurricane wind scale. Intense rainfall is shown within Irma's nearly circular eye. This 3-D cross-section through Irma's eye was...