
Disasters

Determining where, when, and how natural hazards may vary and affect people at the global scale is fundamental to formulating mitigation strategies, appropriate and timely responses, and robust recovery plans. Specifically, NASA near-real-time precipitation estimates are used for regional assessments of current and potential wildfires and landslide activity.
Modeling Landslide Threats in Near Realtime
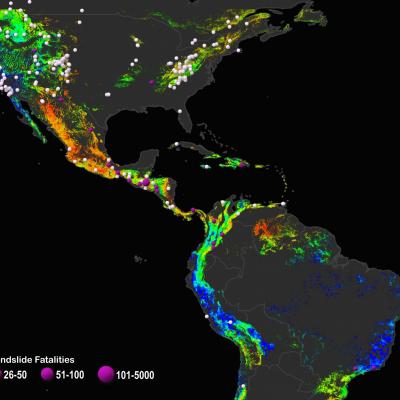
For the first time, scientists can look at landslide threats anywhere around the world in near real-time, thanks to satellite data and a new model developed by NASA. The model, developed at NASA's Goddard Space Flight Center in Greenbelt, Maryland, estimates potential landslide activity triggered by rainfall. Rainfall is the most widespread trigger of landslides around the world. If conditions beneath Earth's surface are already unstable, heavy rains act as the last straw that causes mud, rocks or debris — or all combined — to move rapidly down mountains and hillsides. A new model has been...
GPM Catches Hurricane Nate's Landfall
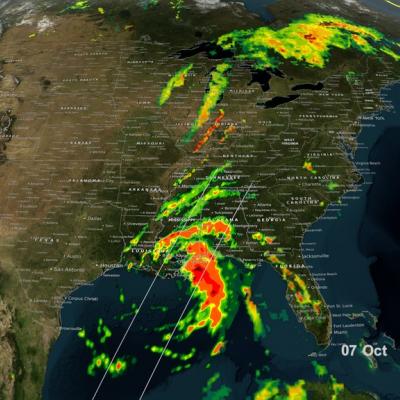
NASA's GPM satellite helped track Nate's progress through the Gulf of Mexico and also captured Nate's landfall on the north central Gulf Coast. This animation shows instantaneous rainrate estimates from NASA's Integrated Multi-satellitE Retrievals for GPM or IMERG product over North America and the surrounding waters beginning on Thursday October 5th when Nate first became a tropical storm near the northeast coast of Nicaragua in the western Caribbean until its eventual landfall on the northern Gulf Coast on Sunday October 8th.
Intense Hurricanes Seen From Space
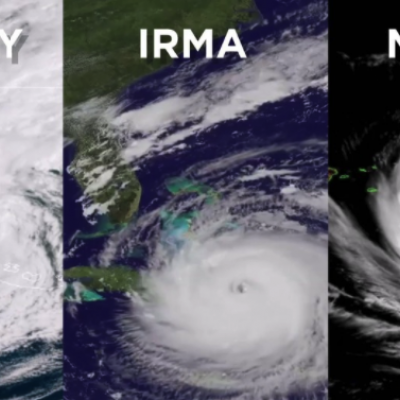
In 2017, we have seen four Atlantic storms rapidly intensify with three of those storms - Hurricane Harvey, Irma and Maria - making landfall. When hurricanes intensify a large amount in a short period, scientists call this process rapid intensification. This is the hardest aspect of a storm to forecast and it can be most critical to people's lives. While any hurricane can threaten lives and cause damage with storm surges, floods, and extreme winds, a rapidly intensifying hurricane can greatly increase these risks while giving populations limited time to prepare and evacuate.
GPM Sees Hurricanes Maria and Jose
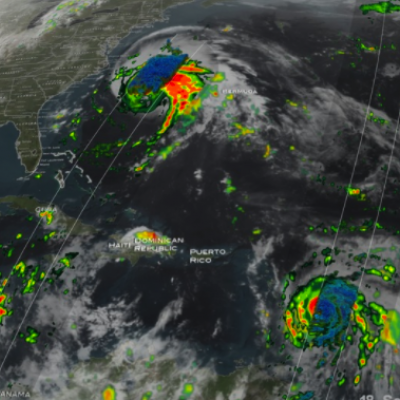
GPM passed over both Hurricane Maria and Hurricane Jose on September 18th, 2017. As the camera moves in on the Maria, DPR's volumetric view of the storm is revealed. A slicing plane moves across the volume to display precipitation rates throughout the storm. Shades of green to red represent liquid precipitation extending down to the ground. The Global Precipitation Measurement (GPM) mission shows the rainfall distribution for two major storms churning in the Atlantic and Caribbean basins. The visualization shows Hurricane Jose as it continues to slowly move northward off the US East Coast east...
GPM Examines Hurricane Irma
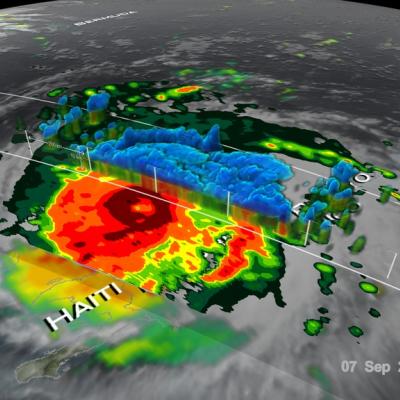
The GPM core observatory satellite had an exceptional view of hurricane Irma's eye when it flew above it on September 5, 2017 at 12:52 PM AST (1652 UTC). This visualization shows a rainfall analysis that was derived from GPM's Microwave Imager (GMI) and Dual-Frequency Precipitation Radar (DPR) data. Irma was approaching the Leeward Islands with maximum sustained winds of about 178 mph (155 kts). This made Irma a dangerous category five hurricane on the Saffir-Simpson hurricane wind scale. Intense rainfall is shown within Irma's nearly circular eye. This 3-D cross-section through Irma's eye was...
Hurricane Irma's Heat Engine Exposed
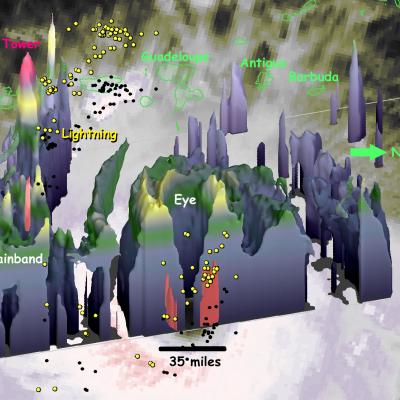
At 1 PM EDT (1700 UTC) on September 5, 2017, the radar on the Global Precipitation Measuring Mission (GPM) satellite captured this 3D view of the heat engine inside of category-5 Hurricane Irma. Under the central ring of clouds that circles the eye, water that had evaporated from the ocean surface condenses, releases heat, and powers the circling winds of the hurricane. The radar on the GPM satellite is able to estimate how much water is falling as precipitation inside of the hurricane, which serves as a guide to how much energy is being released inside the hurricane's central "heat engine."...
GPM Captures Hurricane Harvey's Rainfall
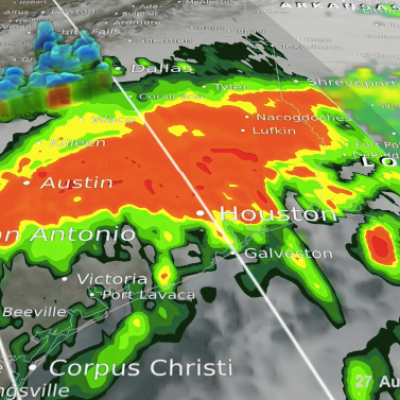
Music: "Whirlpool," Michael Jan Levine, Killer Tracks The Global Precipitation Measurement (GPM) Core Observatory captured these images of Hurricane Harvey at 11:45 UTC and 21:25 UTC on the 27th of August nearly two days after the storm made landfall as it was meandering slowly southeast at just 2 mph (~4 kph) near Victoria, Texas west of Houston. The image shows rain rates derived from GPM's GMI microwave imager (outer swath) and dual-frequency precipitation radar or DPR (inner swath) overlaid on enhanced visible/infrared data from the GOES-East satellite. Harvey's cyclonic circulation is...
Harvey Hits Texas, Unleashes Major Flooding
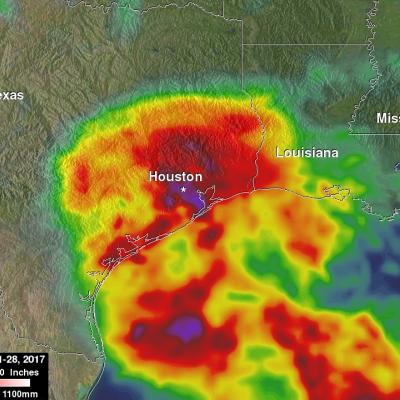
Despite its earlier demise, after rejuvinating over the warm waters of the Gulf of Mexico, Hurricane Harvey has become a major weather maker as it unleashes historical flooding over parts of coastal Texas. Harvey began on the 17th of August as a weak tropical storm about 250 miles (~400 km) east of Barbados in the Leeward Islands. Over the next two days, Harvey continued moving steadily westward passing through the Leeward Islands as a still weak tropical storm and entered into the east central Caribbean. On the 19th, Harvey succumbed to the effects of northeasterly wind shear over the central...
A New Multi-dimensional View of a Hurricane
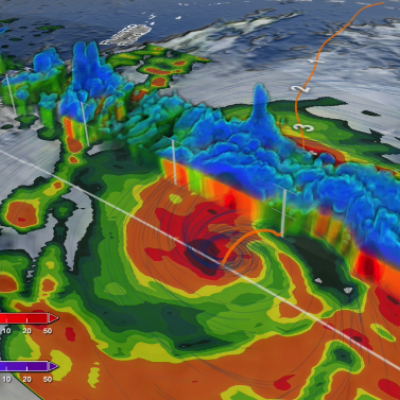
Download in high resolution from the NASA Goddard Scientific Visualization Studio NASA researchers now can use a combination of satellite observations to re-create multi-dimensional pictures of hurricanes and other major storms in order to study complex atmospheric interactions. In this video, they applied those techniques to Hurricane Matthew. When it occurred in the fall of 2016, Matthew was the first Category 5 Atlantic hurricane in almost ten years. Its torrential rains and winds caused significant damage and loss of life as it coursed through the Caribbean and up along the southern U.S...
Another Pineapple Express Brings More Rain, Flooding to California
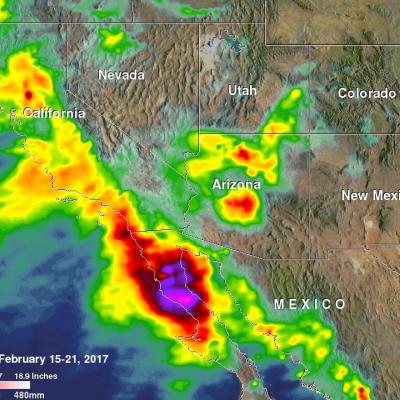
The West Coast is once again feeling the effects of the "Pineapple Express". Back in early January one of these "atmospheric river" events, which taps into tropical moisture from as far away as the Hawaiian Islands, brought heavy rains from Washington and Oregon all the way down to southern California. This second time around, many of those same areas were hit again. The current rains are a result of 3 separate surges of moisture impacting the the West Coast. The first such surge in this current event began impacting the Pacific coastal regions of Washington, Oregon, and northern California on...