Weather

Earth’s climate is changing. The accumulation of greenhouse gases has affected the oceans and ice systems as well as the atmosphere, which in turn impacts the water cycle. To predict future changes in weather and climate and estimate environmental variables, scientists use sophisticated computer models. These models rely on available global data to describe the conditions that exist today to project how conditions may change in the future. GPM’s Weather, Climate, and Land Surface Modeling Applications area promotes the use of precipitation measurements from GPM satellites to help model future behavior of precipitation patterns and climate. 

GPM Sees Hurricane Matthew Nearing Florida
UPDATE 10/6/16: NASA's Global Precipitation Measurement mission or GPM core observatory satellite flew over Hurricane Matthew several times as the category 4 storm headed toward Florida. The GPM Core Observatory carries two instruments that show the location and intensity of rain and snow, which defines a crucial part of the storm structure – and how it will behave. The GPM Microwave Imager sees through the tops of clouds to observe how much and where precipitation occurs, and the Dual-frequency Precipitation Radar observes precise details of precipitation in 3-dimensions. This data...
NASA Sees Hermine's Twin Towers
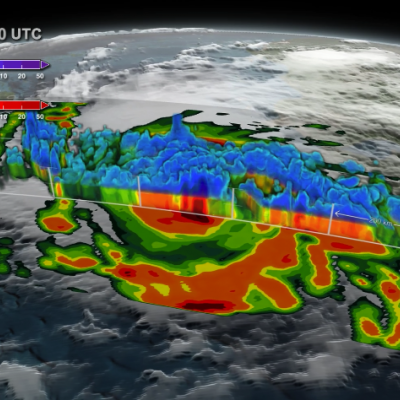
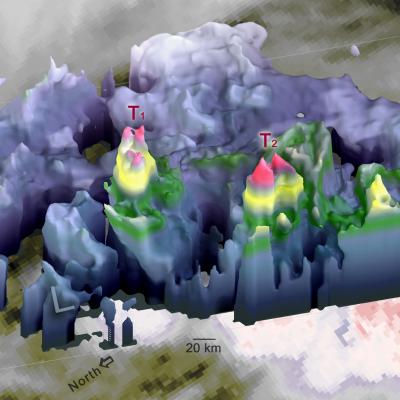
In order for Hermine or any other tropical depression, to intensify there must be a pathway for heat energy from the ocean surface to enter the atmosphere. For Hermine, the conduit may have been one of the two "hot towers" that the Global Precipitation Measurement mission or GPM core satellite observed on Aug. 31 at 4:09 p.m. EDT (2009 UTC). GPM's DPR instrument saw strong storms near the center of Tropical Depression Hermine on the evening of Aug. 31. Two "hot towers" are seen to the right of the low pressure center (south and east of the center), which are labeled "T1" and "T2." The "L"...
Storm Brings Heavy Precipitation to Northeast
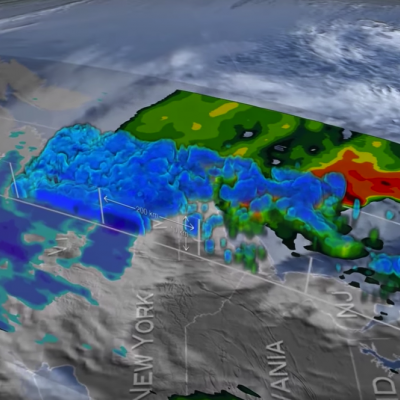
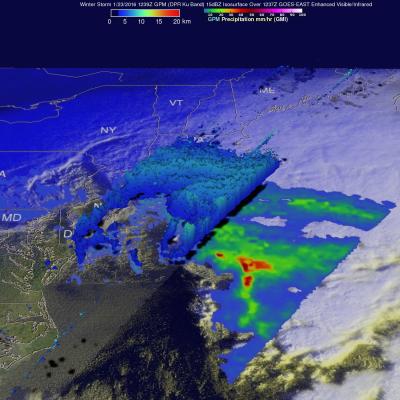
UPDATE 1/23/2016 5:00pm ET On January 23, 2016 at 1239 UTC (7:39 AM EST) the GPM core observatory passed above the deadly winter storm that was burying the Northeast under a deep layer of snow. As GPM passed above a band of snow was shown approaching the island of Manhattan. The winter storm was predicted to dump near record snowfall in New York city. GPM's Microwave Imager (GMI) and Dual-frequency Precipitation Radar (DPR) instruments showed massive amounts of moisture being transported from the Atlantic Ocean over states from New York westward through West Virginia. GPM's Radar instruments...
<iframe width="490" height="276" src="https://www.youtube.com/embed/oiGzKmfOvkg?rel=0" frameborder="0" allowfullscreen></iframe>
As we enter the new year, take a look back at the snowstorms, tropical storms, typhoons, hurricanes and floods captured and analyzed by the Global Precipitation Measurement (GPM) mission from around the globe during 2015. The complete list of storms by date and location are as follows: 1. New England Nor’easter – January 26 – New England, USA 2. Snowstorm – February 17 – Kentucky, Virginia and North Carolina, USA 3. Tornadic Thunderstorms in Midwest – March 25 – Oklahoma and Arkansas, USA 4. Typhoon Maysak – March 30 – Yap Islands, Southwest Pacific Ocean 5. Rain Accumulation from Cyclone...
Hurricane Patricia Makes Landfall in Mexico
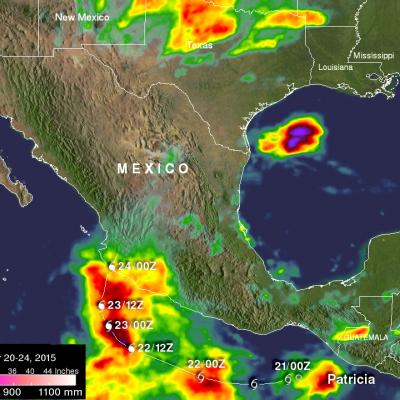
The eye of hurricane Patricia hit the Mexican coast on October 23, 2015 at approximately 6:15 PM CDT(2315 UTC)near Cuixmala, Mexico. The maximum winds at that time were estimated to be 143 kts (165 mph). Patricia is weakening rapidly but continued heavy rain is expected to cause flash floods and mudslides in the Mexican states of Nayarit, Jalisco, Colima, Michoacan and Guerrero through Saturday October 24, 2015. Over the weekend the remants of Patricia are also expected to add to the extreme rainfall in Texas. Rainfall from a stalled front that has been causing flooding in northern and central...
https://www.youtube.com/watch?v=8eIwMXnU8IA&feature=youtu.be
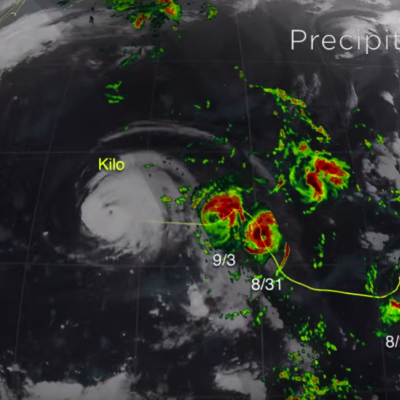
A narrated visualization of Typhoon Kilo. Click here for a full transcript. Click here to download this video in high resolution from the NASA Goddard Scientific Visualization Studio. The Global Precipitation Measurement (GPM) mission core satellite provided many views of Tropical Cyclone Kilo over its very long life. GPM is a satellite co-managed by NASA and the Japan Aerospace Exploration Agency that has the ability to analyze rainfall and cloud heights. GPM was able to provide data on Kilo over its 21 day life-span. The GPM core observatory satellite flew over Kilo on August 25, 2015 at...
GPM Sees Tropical Storm Bill Over Texas
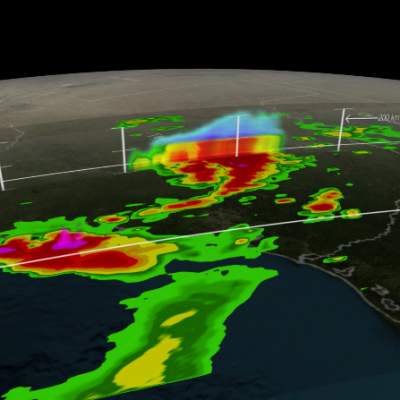
Download in hi-res from the NASA Goddard Scientific Visualization Studio Tropical Storm Bill made landfall over Texas at approximately 11:45am CST on June 16, 2015. Shortly after midnight, GPM passed over the storm as it slowly worked it's way northward across the already drenched state of Texas. This visualization shows Bill at precisely 12:11:27am CST (6:11:27 GMT) on June 17, 2015. The GPM Core Observatory carries two instruments that show the location and intensity of rain and snow, which defines a crucial part of the storm structure – and how it will behave. The GPM Microwave Imager sees...
3D Views of February Snow Storms from GPM
Download this video in HD formats from NASA Goddard's Scientific Visualization Studio The Global Precipitation Measurement (GPM) Core Observatory captured a 3-D image of a winter storm on Feb. 17, 2015, that left 6 to 12 inches of snow over much of Kentucky, southwestern West Virginia and northwestern North Carolina. The shades of blue indicate rates of snowfall, with more intense snowfall shown in darker blue. Intense rainfall is shown in red. The imagery shows great variation in precipitation types over the southeastern United States. Download this video in HD formats from NASA Goddard's...
Signs of Spring Spring Weather What is spring to you?  Spring around the world March 20 - launch of contest
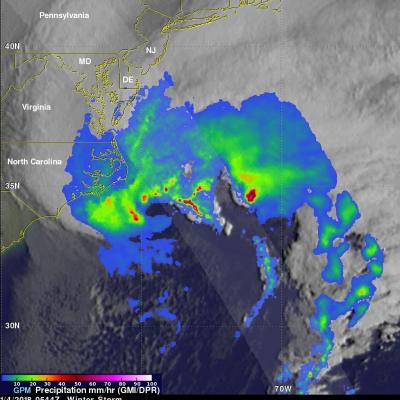
At 5:05 p.m. EST Monday, Jan. 26, 2015, the Global Precipitation Measurement mission's Core Observatory flew over the Nor'easter that dumped snow on New England. This satellite image shows the rate of rainfall, with low amounts in green and high in red, and snowfall, in blue to purple. The center of the storm, shown in 3-D, was offshore with far reaching bands of snowfall. More intense snow rates are shown in darker blue, which can be seen on the northern edge of the storm. Visible in the 3-D image of the center of the storm are the snowy tops of the clouds in blue and underneath where it...
GPM Dissects Super Typhoon Hagupit
On December 5, 2014 (1032UTC) the Global Precipitation Measurement (GPM) mission's Core Observatory flew over Typhoon Hagupit as it headed towards the Philippines. A few hours later at 1500 UTC (10 a.m. EST), Super Typhoon Hagupit's maximum sustained winds were near 130 knots (149.6 mph/241 kph), down from 150 knots (172 mph/277.8 kph). Typhoon-force winds extend out 40 nautical miles (46 miles/74 km) from the center, while tropical-storm-force winds extend out to 120 miles (138 miles/222 km). Animation revealing a swath of GPM/GMI precipitation rates over Typhoon Hagupit. As the camera moves...