Weather

Earth’s climate is changing. The accumulation of greenhouse gases has affected the oceans and ice systems as well as the atmosphere, which in turn impacts the water cycle. To predict future changes in weather and climate and estimate environmental variables, scientists use sophisticated computer models. These models rely on available global data to describe the conditions that exist today to project how conditions may change in the future. GPM’s Weather, Climate, and Land Surface Modeling Applications area promotes the use of precipitation measurements from GPM satellites to help model future behavior of precipitation patterns and climate. 

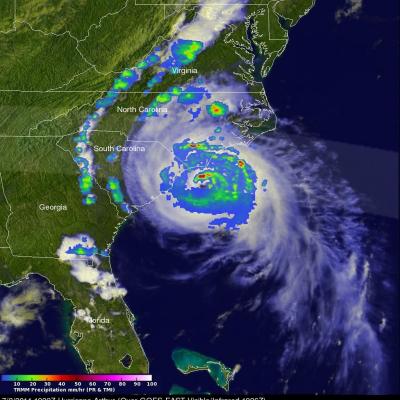
5 Year Anniversary of Hurricane Arthur
TRMM overpass of Hurricane Arthur from July 3, 2014. View fullscreen in STORM Event Viewer June marks the official start of the Atlantic hurricane season. And although strong tropical cyclones are rare in June in the Atlantic, it will soon be the 5-year anniversary of Hurricane Arthur, which became a tropical depression in very late June 2014 before hitting the Outer Banks of North Carolina as a Category 2 hurricane in early July. As with most storms early in the season, Arthur formed not from a tropical wave moving off the coast of Africa but from an old frontal boundary that stalls off the...
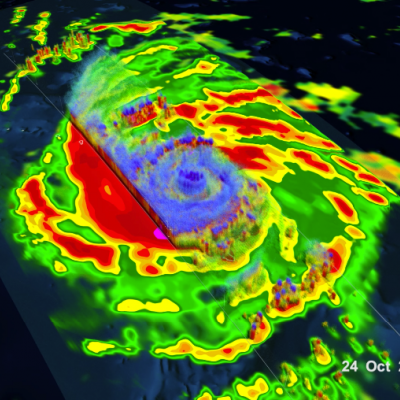
GPM Catches Typhoon Yutu Making Landfall
NASA's GPM Core observatory satellite captured an image of Super Typhoon Yutu when it flew over the powerful storm just as the center was striking the central Northern Mariana Islands north of Guam. Early Thursday, Oct. 25 local time, Super Typhoon Yutu crossed over the U.S. commonwealth of the Northern Mariana Islands. It was the equivalent of a Category 5 hurricane. The National Weather Service in Guam said it was the strongest storm to hit any part of the U.S. this year. Download this video in high resolution from the NASA Goddard Scientific Visualization Studio Download video without...
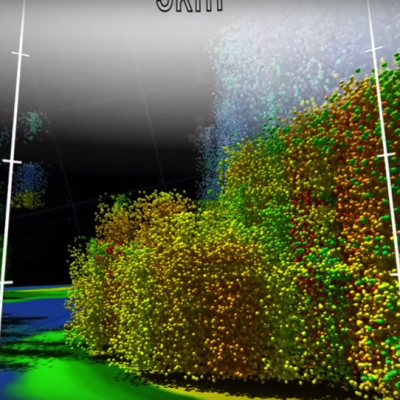
Dive Into a 360-View of Hurricane Maria
Two days before Hurricane Maria devastated Puerto Rico, the NASA/JAXA Global Precipitation Measurement Core Observatory satellite captured a 3D view of the 2017 storm. At the time Maria was a category 1 hurricane. The 3-D view reveals the processes inside the hurricane that would fuel the storm’s intensification to a category 5 storm within 24 hours. For the first time in 360 degrees, this data visualization takes you inside the hurricane. The precipitation satellite has an advanced radar that measures both liquid and frozen water. The brightly colored dots show areas of rainfall, where green...
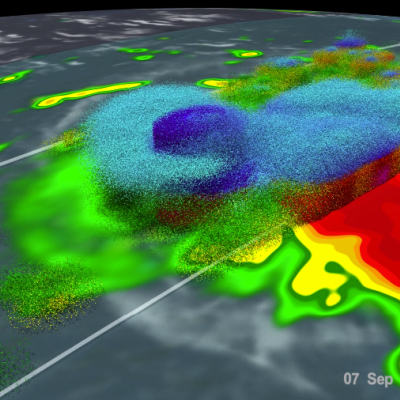
GPM Flies Over Tropical Cyclone Florence
Download in High Resolution from the NASA Goddard Scientific Visualization Studio GPM passed over Tropical Storm Florence on September 7, 2018. As the camera moves in on the storm, DPR's volumetric view of the storm is revealed. A slicing plane moves across the volume to display precipitation rates throughout the storm. Shades of green to red represent liquid precipitation. Frozen precipitation is shown in cyan and purple. NASA's Global Precipitation Measurement mission or GPM core observatory satellite flew over Tropical Storm Florence on September 7, 2018. At that time, the storm was...
GPM Sees Powerful Winter Storm Grayson
Powerful Coastal Storm Brings Snow, Extreme Cold, Wind and Blizzard Conditions to the East Coast View an interactive 3D visualization of GPM data from Winter Storm Grayson in STORM Event Viewer Mobile version Cold Artic air has been keeping the vast majority of the country east of the Rockies in the deep freeze over the past week. Now a powerful coastal storm is working its way up the East Coast bringing a mixture of snow, freezing rain, high winds and blizzard conditions from as far south as Florida all the way up into Maine with blizzard warnings in effect along the coast from North Carolina...
GPM Catches Nor'easter over New England
At the time of the Global Precipitation Measurement (GPM) Core Observatory overpass (April 1, 2017, 0550 UTC), the storm's center of low pressure was south of Long Island. At the mid-levels of the atmosphere, the circulation was centered over northeast Pennsylvania. This led to a classic overrunning, warm conveyor setup, which happened when the counterclockwise low level flow drew in cold air out of the north/northeast (hence "Nor'easter") from Canada. Higher up, warm and moist air from further south was lifted over this cold air and resulted in precipitation in the form of snow at the surface...
GPM Measures Tropical Cyclone Debbie
Tropical cyclone Debbie formed in the Coral Sea northeast of Australia om March 24, 2017. Debbie intensified and had hurricane force wind speeds within a day of formation. While headed toward northeastern Australia Debbie reached it's maximum sustained wind speeds estimated at over 100 kts (115 mph) on March 27, 2017 (UTC). Tropical cyclone Debbie came ashore on March 28th and brought destructive winds and extremely heavy rain to northeastern Australia. It was reported that heavy rainfall caused flash flooding that cut off a coastal town and covered several roads in Queensland. The GPM...