IMERG Measures Flooding Rainfall in India
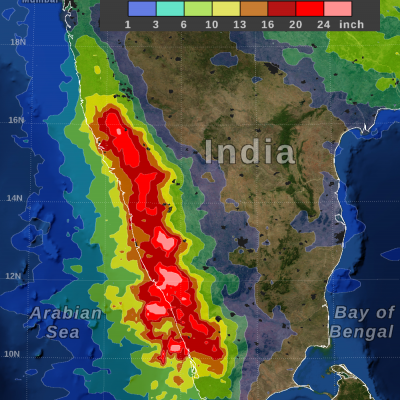
In early August 2019 a depression formed in the Bay of Bengal that moved over India contributing to heavy rainfall on India's west coast. NASA's satellite data analysis suggests that from August 5 though 11, two feet of rain fell in some places. This estimate is from the GPM-based realtime multi-satellite algorithm called IMERG, which is run at NASA Goddard. Credit: Owen Kelley (NASA GSFC)