

GPM IMERG Measures Hurricane Michaels Rainfall Accumulation
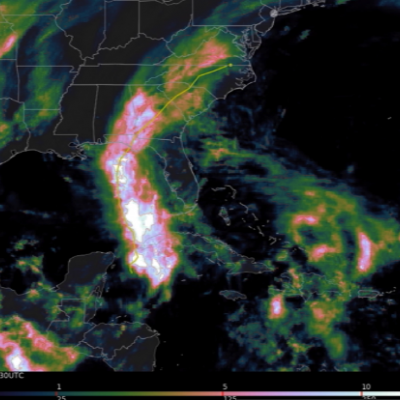
At least eleven deaths have now been attributed to deadly hurricane Micheal. Some casualties resulted not only from Micheal's destructive winds and storm surges but also from the blinding rain that Micheal produced as it battered states from Florida northeastward through Virginia. Today tropical storm Micheal is moving out over the Atlantic Ocean and has transitioned into a powerful extratropical storm. This animation using the GPM IMERG multi-satellite dataset shows the estimated total rainfall accumulation for #HurricaneMichael from 10/8/18 - 10/12/18. Learn more: https://t.co/aJuEp6o855 pic