Tropical Cyclones

The GPM Mission provides insight into how and why some tropical cyclones intensify and others weaken as they move from tropical to mid-latitude systems. The GPM Core Observatory’s GMI and DPR instruments allow scientists to study the internal structure of storms throughout their life cycle, and view how they change over time.

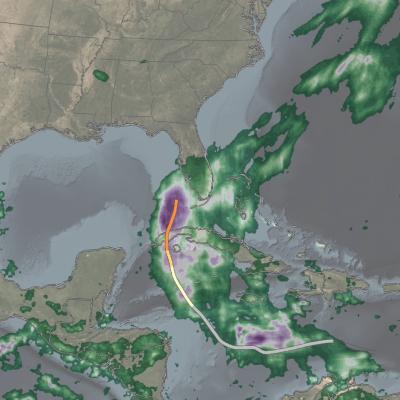
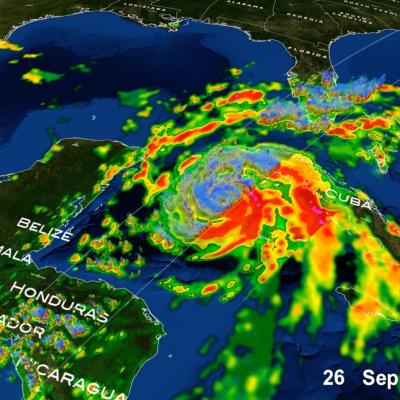
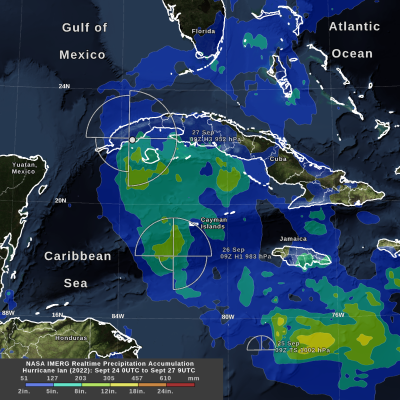
IMERG precipitation totals from Hurricane Ian
Hurricane Ian formed in the Caribbean Sea on Sept. 26, 2022. Ian intensified to Category 3 hurricane on the Saffir-Simpson scale by the time it made landfall in western Cuba early the next day. NASA's near real-time IMERG algorithm was used to estimate the precipitation from Ian during its formation and intensification. IMERG shows that Ian's largest rainfall accumulation so far, over 12 inches, occurred while it was only a tropical storm and not yet a hurricane. The National Hurricane Center provided an estimate of the distance that tropical storm-force winds extended from Ian's low-pressure
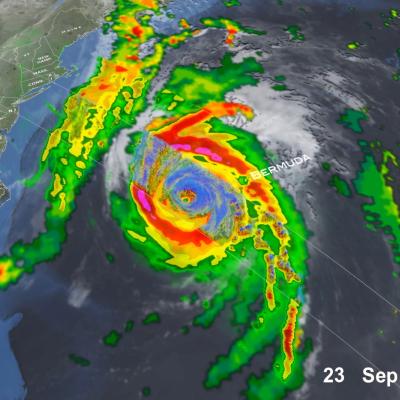
GPM overpass of Hurricane Fiona on Sept. 23, 2022.
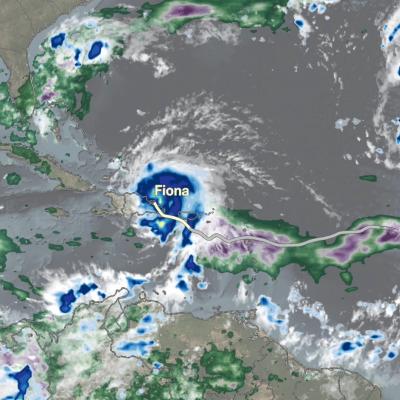
After leaving the Caribbean, Hurricane Fiona became both the strongest and the first major hurricane of the 2022 Atlantic hurricane season as it made its way northward through the western Atlantic. Fiona began as an African easterly wave that moved across the tropical Atlantic in the direction of the Caribbean. While still about 800 miles east of the Leeward Isles, this wave organized into a tropical depression on Sept.14th. Later that same day, the depression strengthened and became Tropical Storm Fiona. Fiona remained a moderate tropical storm as it passed through the Leeward Isles on the
IMERG precipitation estimates from Hurricane Fiona
In September 2022, Hurricane Fiona had impacts in the Caribbean, on Bermuda, and in Canada. NASA's satellites and science algorithms helped to monitor this hurricane in near real time.
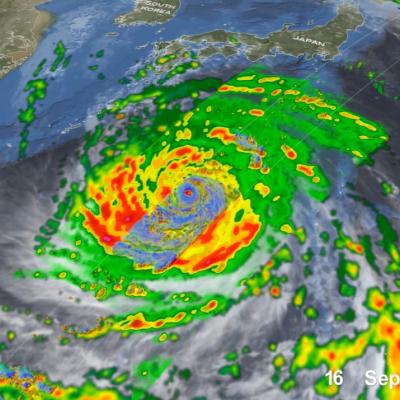
GPM overpass of Typhoon Nanmadol
Super Typhoon Nanmadol became one of the strongest typhoons to threaten Japan since records began in 1951. Nanmadol began as a tropical disturbance, basically an area of active thunderstorms, on September 11th southeast of Iwo Jima about midway between Tokyo and Guam. After moving to the southwest for 2 days, this disturbance became better organized and formed into a depression on the 13th. The system then made a counterclockwise loop, moving first back to the northeast before turning back again towards the west. Over this time, the system slowly intensified, becoming Tropical Storm Nanmadol
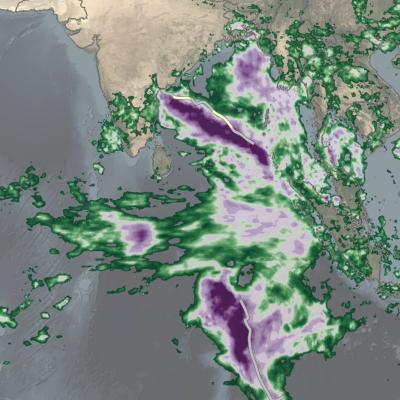
IMERG totals from twin cyclones in the Indian Ocean
Over the past several days, a relatively rare event occurred in the eastern Indian Ocean: the formation of “twin” tropical cyclones. Tropical Cylones Karim and Asani formed at nearly the exact same time (06:00 UTC and 06:30 UTC, 12:00 pm and 12:30 pm local time) on May 7 on opposite sides of the Equator. Karim officially formed first in the southern hemisphere (SH) followed immediately by Asani in the northern hemisphere (NH). At first glance, the cyclones appear to be mirror images of one another with Asani rotating counterclockwise in the NH and Karim rotating clockwise in the SH roughly
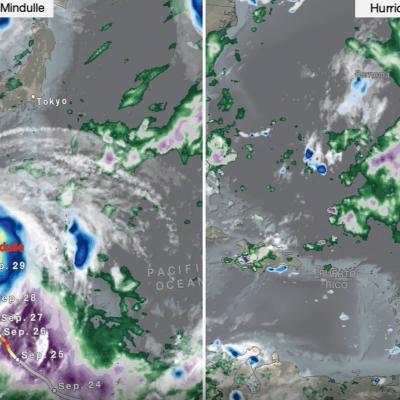
IMERG Comparison of Typhoon Mindulle and Hurricane Sam
From late Sept. through early Oct. 2021, two powerful storms churned over the Pacific and Atlantic Oceans: Typhoon Mindulle, which peaked as a Category 5 storm, and Hurricane Sam, a Category 4 hurricane and one of the longest-lived hurricane-strength storms on record over the Atlantic Ocean. While neither storm posed a direct threat to land, Mindulle brushed by eastern Japan, leaving heavy rainfall accumulations in the area near Tokyo. Despite the fact that neither storm made landfall, the storms’ slow-motion tracks across warm ocean waters allows an opportunity to observe how the strong winds
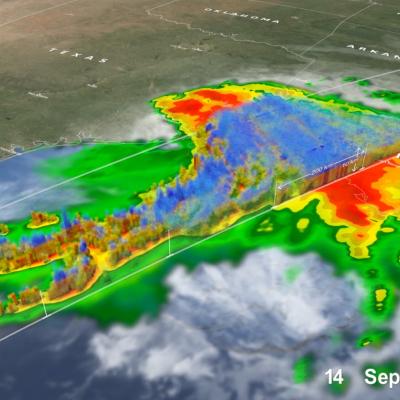
GPM overpass of Hurricane Nicholas
Although it only reached hurricane status for a brief period, Hurricane Nicholas made an impact on the northern Gulf Coast by bringing heavy rains to an area still recovering from the devastating effects of powerful Hurricane Ida, which made landfall in Louisiana just over 2 weeks earlier. Nicholas formed after a tropical wave passed over the Yucatan Peninsula and into the Bay of Campeche, providing a focus for shower and thunderstorm development. On the morning of Sunday September 12th, the National Hurricane Center (NHC) found that this area of storms had developed a closed circulation with
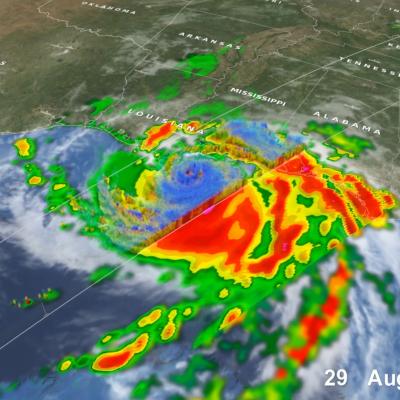
NASA/JAXA GPM Satellite Eyes Hurricane Ida Shortly Before Landfall
Hurricane Ida struck southeast Louisiana as a powerful Category 4 storm on Sunday, Aug. 29, 2021 - the 16th anniversary of Hurricane Katrina’s landfall in 2005. Ida brought destructive storm surge, high winds, and heavy rainfall to the region, and left over 1 million homes and businesses without power, including the entire city of New Orleans. The NASA / JAXA GPM Core Observatory satellite flew over the eye of Ida shortly before landfall at 10:13 a.m. CDT (1513 UTC), capturing data on the structure and intensity of precipitation within the storm. This animation shows NASA's IMERG multi
GPM DPR overflight of Hurricane Henri 22 Aug 2021
In the North Atlantic, the tropical system known as Henri reached hurricane status on Saturday, August 21, 2021. At the time, it was approaching a landfall in New England. Between Friday and Sunday, Henri was observed three times by the Dual-frequency Precipitation Radar (DPR) on the core satellite of NASA's Global Precipitation Measurement (GPM) mission. The GPM satellite's first two flyovers of Henri occurred just 10 hours apart and revealed a remarkably unchanging structure that was being impacted by wind shear. A third overflight occurred a day later, when wind shear had abated and Henri
IMERG Rainfall Totals from Cyclone Tauktae
NASA combined data from multiple satellites in the GPM Constellation to estimate precipitation rates and totals from Tropical Cyclone Tauktae in May 2021. The below animation shows precipitation rates (blue/yellow shading) and accumulations (green shading) at half-hourly intervals from May 12-19, 2021, derived from NASA's IMERG algorithm. Underneath the precipitation data, cloud cover is shown in shades of white/gray based on geosynchronous satellite infrared observations. On top of the precipitation data, the cyclone's approximate track is displayed based on estimates from the Joint Typhoon