Logo for GPM Applications showing ecology, water and agriculture, energy, disasters, health, and weather.

Applications


Overview

The Global Precipitation Measurement (GPM) mission has several cross-cutting application areas which contribute to and enhance our understanding of weather forecasting, disasters, ecology, health, water and agriculture and energy. Using advanced space-borne instruments, GPM measures light rain to heavy rain and falling snow, producing a near-global view of precipitation every 30 minutes. Through improved measurements of rain and snow, precipitation data from the GPM mission is used by a diverse range of applications and user communities at local to global scales to inform decision making and policy that directly benefits society. 

Sections

What are Applications? 

“Applications” refers to the use of mission data products in decision-making activities for societal benefit. Mission Applications take a satellite's data products and expands them into areas where they can help inform policy or decisions. 

Learn more about Applied Sciences at NASA

Who's Using GPM Data?

Learn about the different people and organizations that are using GPM and other NASA Earth data to help improve life around the world. 

View Articles


GPM Mentorship Program

NASA’s GPM applications team and University of Coimbra’s Earth and Space Science Center (CITEUC Portugal) have collaborated to host the GPM Mentorship Program for several years.

The program supports new and existing user communities to provide a tailored hands-on learning experience in using GPM data for applications. It provides participants with training and tools to use state-of-the-art GPM satellite-based precipitation estimates, and helps them apply GPM data to support real-world problems and benefit their communities. 

Learn more about each GPM Mentorship Program session2024, 2023, 2022


GPM Data for Decision Making

Are you using GPM satellite precipitation data in your work, or would you like to? Share your story with our team, or ask us any questions you may have using our contact form.

We also encourage you to get involved in GPM applications by attending an applications event or accessing the free and publicly available data in the data section of this site

  • Dalia Kirschbaum (NASA GSFC), GPM Mission Associate Deputy Project Scientist for Applications
  • Andrea Portier (NASA GSFC / SSAI), GPM Applications and Outreach Coordinator
  • Dorian Janney (NASA GSFC / ADNET), GPM Outreach Specialist
  • Jacob Reed (NASA GSFC / Telophase), GPM Web Developer

Applications Featured Resources

GPM Uncovers Compact Eyewall in Hurricane Simon
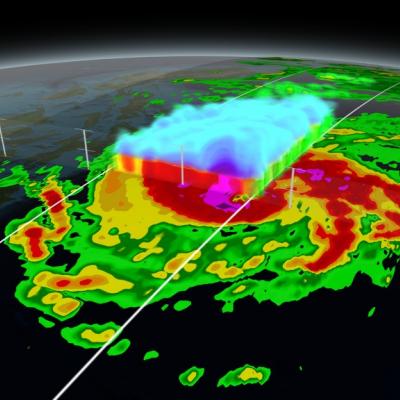
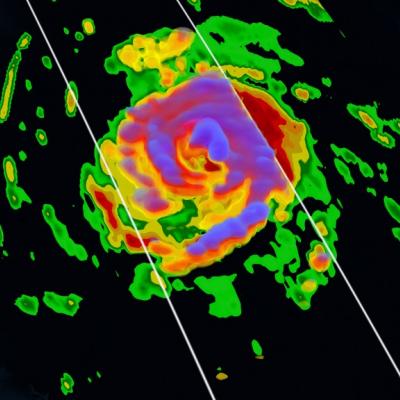
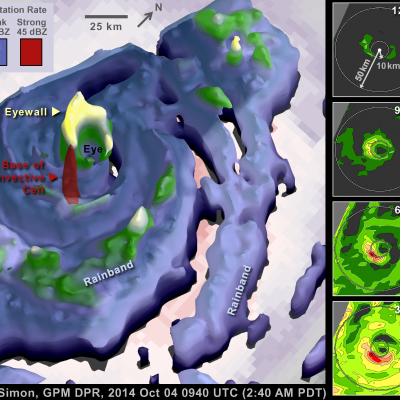
Hurricane Simon appeared to be keeping a secret before it rapidly intensified on Oct. 4, but the Global Precipitation Measurement or GPM satellite was able uncover it. On Oct. 4 at 0940 UTC (5:40 a.m. EDT) observations by the Ku-band radar on the GPM satellite suggested that the Eastern Pacific Ocean's Hurricane Simon was hiding a very compact eyewall hours before the National Hurricane Center detected rapid intensification of Simon's surface winds. The GPM satellite was launched in February of this year and is managed by both NASA and the Japan Aerospace Exploration Agency. On Oct. 4 at 0940...
PMM Article Image
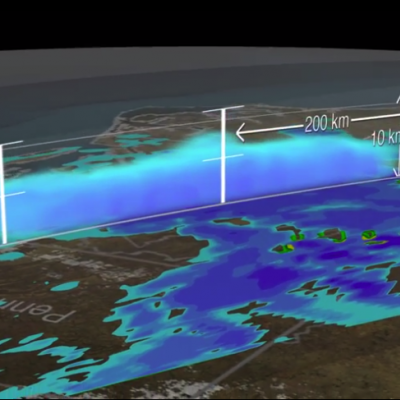
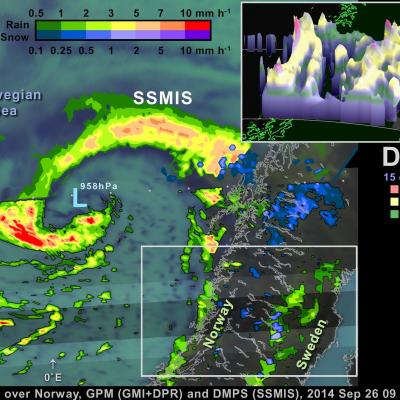
On September 26, the Global Precipitation Measurement (GPM) satellite flew over an extra-tropical cyclone whose center was approaching Norway. The Norwegian weather service reported that this storm brought gale-force winds to parts of Norway's coast and mountains (20 m/s in the mountains and 50 m/s just off-coast, late at night on September 26). Extra-tropical cyclones this strong or stronger are a regular feature of northern European winters. The particularly damaging ones are called "windstorms." Borrowing a page from hurricane forecasters, some weather agencies in affected countries name...
GPM Captures Hurricane Odile
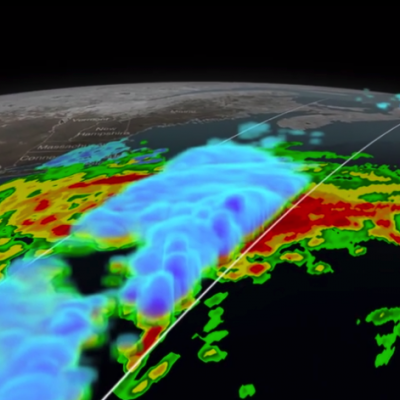
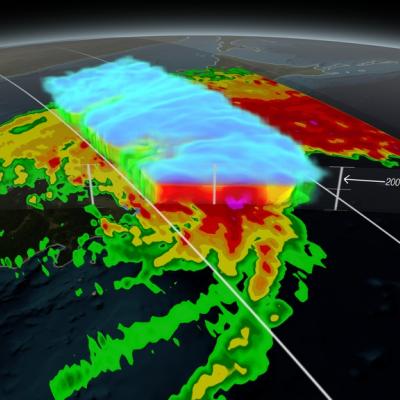
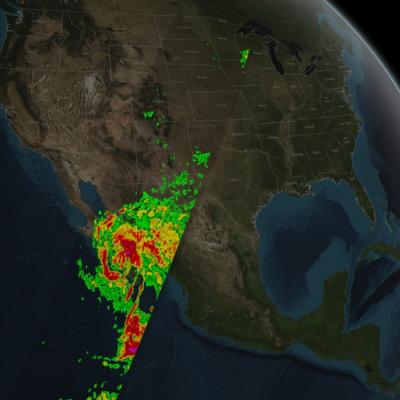
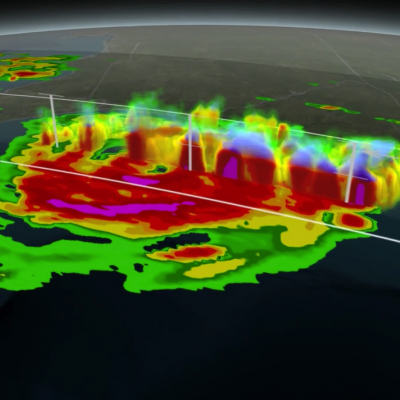
​ ​ Animation revealing a swath of GPM/GMI precipitation rates over Hurricane Odile. The camera then moves down closer to the Hurricane to reveal DPR's volumetric view of Odile. As the camera rotates around the Hurricane, a slicing plane dissects Odile revealing it's inner precipitation rates closer to the eye. Shades of blue indicate frozen precipitation (in the upper atmosphere). Shades of green to red are liquid precipitation which extend down to the ground. On September 15, 2014 (15:11 UTC) the Global Precipitation Measurement (GPM) mission's Core Observatory flew over Hurricane Odile as...
GPM Satellite Sees First Atlantic Hurricane
Animation of NASA-JAXA's GPM satellite data of rain rates and internal structure of Hurricane Arthur on July 3 2014. Image Credit: NASA's Scientific Visualization Studio / JAXA Download the Hi-Res Video Here The Global Precipitation Measurement (GPM) Core Observatory flew over Hurricane Arthur five times between July 1 and July 5, 2014. Arthur is the first tropical cyclone of the 2014 Atlantic hurricane season. GPM is a joint mission between NASA and the Japan Aerospace Exploration Agency. The Core Observatory was launched Feb. 27 from Japan and began its prime mission on May 29, just in time...
Super Typhoon Haiyan Hits the Philippines
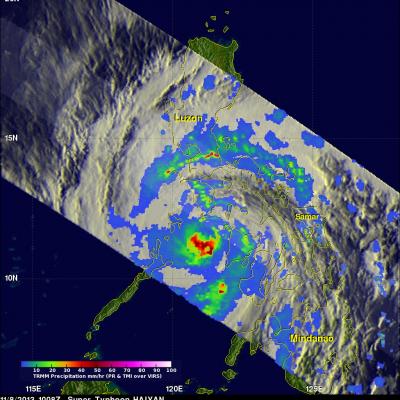
Super typhoon Haiyan, equivalent to a Category 5 hurricane on the US Saffir-Simpson scale, struck the central Philippines municipality of Guiuan at the southern tip of the province of Eastern Samar early Friday morning at 20:45 UTC (4:45 am local time) as an extremely powerful super typhoon, perhaps the strongest ever recorded at landfall, with sustained winds estimated at 195 mph (315 kph) by the Joint Typhoon Warning Center. Previously, Hurricane Camille, which struck the northern Gulf Coast in 1969, held the record with 190 mph sustained winds at landfall. After striking Samar, Haiyan...
NASA satellites used to predict zebra migrations
Of stars and stripes: NASA satellites used to predict zebra migrations One of the world's longest migrations of zebras occurs in the African nation of Botswana, but predicting when and where zebras will move has not been possible until now. Using NASA rain and vegetation data, researchers can track when and where arid lands begin to green, and for the first time anticipate if zebras will make the trek or, if the animals find poor conditions en route, understand why they will turn back. Covering an area of approximately 8,500 square miles (22,000 square kilometers), Botswana’s Okavango Delta is...
Aerial photo of 2010 landslide in Gansu, China
By Lisa-Natalie Anjozian , NASA Goddard Space Flight Center Original www.nasa.gov Press Release (published 11/27/12) A NASA study using TRMM satellite data revealed that the year 2010 was a particularly bad year for landslides around the world. Around midnight on August 8, 2010, a violent surge of loosened earth roared down mountain slopes and slammed into quietly sleeping neighborhoods in Zhouqu County in Gansu, China. The catastrophic mudslides—the deadliest in decades according to state media—buried some areas under as much as 23 feet (7 meters) of suffocating sludge. 1,765 people died...
The NPOL radar and a Summer Tanger
By Ellen Gray , NASA Goddard Space Flight Center Original www.nasa.gov Press Release (published 6/7/12) NASA and Nature Conservancy Agreement Supports [no-glossary]Precipitation[/no-glossary] and Migratory Bird Research The NASA NPOL radar is a research grade S-band, scanning dual-polarimetric radar. It underwent a complete antenna system upgrade in 2010 and is one of two fully transportable research-grade S-band systems in the world. It is used to make accurate volumetric measurements of precipitation including rainfall rate, particle size distributions, water contents and precipitation type...
TRMM image of hurricane Irene intesifying as it nears the Bahamas
UPDATE: Monday, August 29th, 2011 Irene Drenches Northeastern United States UPDATE: Friday, August 26th, 2011 Irene Passes Through the Bahamas, Heads Towards Cape Hatterus Wednesday, August 24th, 2011 After becoming a small hurricane while passing over Puerto Rico, Irene re-emerged over the warm, open waters of the western Atlantic northwest of the Dominican Republic on the morning of August 22nd. The storm quickly showed signs of intensifying as deep convective towers arose near the center of Irene, releasing heat into the core of the system. In response, Irene's central pressure fell and...

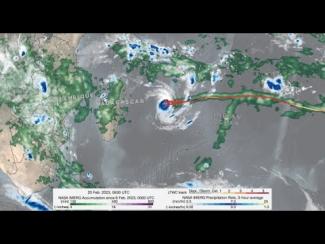
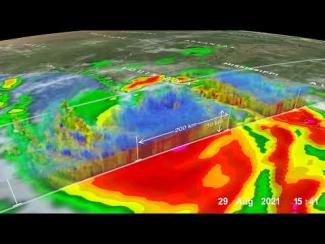
GPM IMERG precipitation rates and totals from Tropical Cyclone Freddy, Feb. 6 - March 12, 2023. Credit: NASA 

Download in high resolution from the NASA Goddard Scientific Visualization Studio

In a series of three half-day virtual meetings, this workshop will focus on current applications and future opportunities of NASA precipitation and cloud data products to support transport and logistical activities for aviation, maritime, roads and highway transportation systems. The workshop will bring together representatives from federal and state operational agencies and private companies to discuss how NASA precipitation and cloud products could be better leveraged to inform decision-making for transport and logistical operations. The workshop will also provide an opportunity for end...

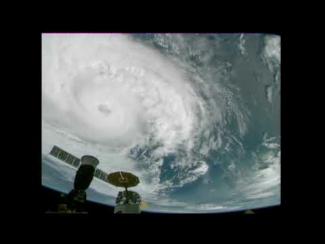
Cameras outside the International Space Station captured dramatic views of Hurricane Zeta at 12:50 pm ET October 28, as it churned 200 miles south-southwest of New Orleans packing winds of 90 miles an hour. Credit: NASA International Space Station

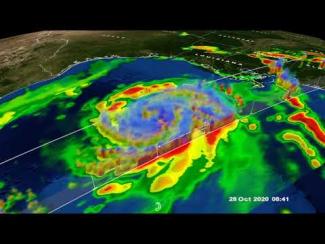
GPM Core Observatory overpass of Tropical Storm Zeta on October 28 at approximately 3:25am CDT (8:25 UTC). Credit: NASA Goddard Scientific Visualization Studio

View an interactive 3D visualization of this overpass in STORM Event Viewer

Hide Body

Hide Date

Hide Main Image

Hide Title