Articles

Typhoon Sinlaku GPM overpass
The GPM Core Observatory flew over the center of Super Typhoon Sinlaku at 12:08 UTC (10:08 pm LST) April 12th, providing a detailed look into the structure and intensity of the precipitation within Sinlaku.
Screenshot of an animation of IMERG precipitation estimates from Tropical Cyclone Narelle in March 2026
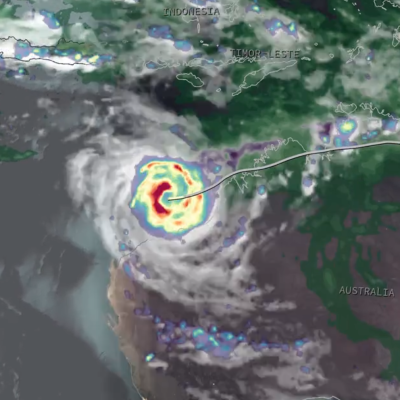
After intensifying into a powerful Category 4 cyclone (Category 5 on the Australian scale) in the Coral Sea, Narelle made landfall on the east coast of Queensland, before continuing on across the Northern Territory, and turning south to make landfall yet again in Western Australia. Along the way, Narelle brought gusty winds and heavy rains to all three regions. Narelle first began as a westward-moving area of low pressure south of the Solomon Islands. Warm sea surface temperatures (SSTs), weakening wind shear, and persistent convective activity allowed the circulation to organize such that the
IMERG Precipitation Anomaly for Day of Year 1 to 30
In many places, the amount of that rain falls on a particular day or hour is influenced by multiple natural cycles that exist simultaneously on different time scales. One such cycle repeats every 24 hours, and another repeats every year. The global extent of these cycles can be studied using NASA's IMERG precipitation estimates that have been generated for 1998 to the present. Most of Earth's precipitation falls as rain, and the rest falls as snow, hail, or other forms of precipitation. The length of IMERG's data record makes it possible to average out some of the random error and unrelated
IMERG view of an atmospheric river impacting Washington State on December 9, 2025
Several atmosphere rivers have recently carried plumes of moisture from the Tropics toward the United States. These plumes of water vapor have contributed to flood-producing storms over Washington State during the first three weeks of December 2025.
Satellite image of IMERG precipitation rates from Hurricane Melissa over Jamaica.
As Hurricane Melissa passed over Jamaica on Oct. 28, 2025, NASA’s IMERG algorithm provided near real-time estimates of rainfall using data from an international constellation of satellites united by the GPM Core Observatory. The below animation of IMERG precipitation rates and accumulations shows data from Oct. 23 through Oct. 29, revealing that central Jamaica received an estimated 18–24 inches of rain, much of it falling on the 28th. These satellite-based estimates were broadly consistent with the National Hurricane Center’s forecast, which anticipated 20–30 inches of rain due to the storm’s