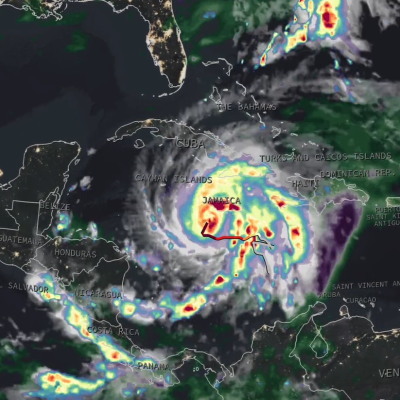
Articles

Photograph of a landslide on a mountain.
What was the exact date the landslide occurred? Leave this blank if you are not sure which day it happened. What time did the landslide occur? Enter the approximate time of the landslide in the local time zone. If unknown, leave blank. Where did the landslide happen? This can be a street address, Latitude and Longitude (if known), or general description. Did it cause any damage? How much? Describe any casualties and damage to infrastructure, property, or the environment. Include numbers if possible. How do you know about the landslide? Indicate your source of information, such as personal
Thumbnail
GPM Precipitation & Applications Global Viewer (v2) Visualize IMERG global satellite precipitation estimates and LHASA landslide nowcasts on an interactive map. NOTE: This app is intended to be viewed on a large computer monitor. Click Here to view Fullscreen This page is a demonstration of the PMM Precipitation and Applications Publisher API. To learn how to use the API for your own applications, please visit: https://pmmpublisher.pps.eosdis.nasa.gov/ https://pmmpublisher.pps.eosdis.nasa.gov/docs For More Information On: the GPM Precipitation products, please see: https://gpm.nasa.gov/data
The NASA GPM Ground Validation Field Campaign at UConn took place in Storrs, Connecticut. The site has multiple instruments provided by the GPM Ground Validation Program. Credit: Diego Cerrai.
Though the last traces of winter are melting away and spring showers are in full swing across the U.S., the story of snow is not quite over for the season. In mid-April, two winter field campaigns involving NASA researchers are wrapping up, bringing with them unprecedented observations of snowfall. Understanding when, where, and how much snow is falling is critical for scientists and the public alike. In the short-term, accurate snowfall data can help weather forecasters prepare communities and plan against hazardous road conditions, power outages, and health risks. Over the long-term, these
Map of the U.S. showing IMERG rainfall totals over the south and central U.S.
This past week, a slow-moving, upper-level system moving through the central U.S. triggered several days of severe weather. The system caused numerous tornadoes, as well as heavy rains and flooding from the Deep South up through the middle Mississippi River Valley and into the Ohio River valley. The situation began when an upper-level area of low pressure situated over the northeast Pacific pivoted down into the central Rockies, creating a deep trough of low pressure aloft that extended down into the northern Baja. This channeled strong jet stream winds from south of the Four Corners region up