TRMM News

Flooding in Eastern Peru, Dry in the West

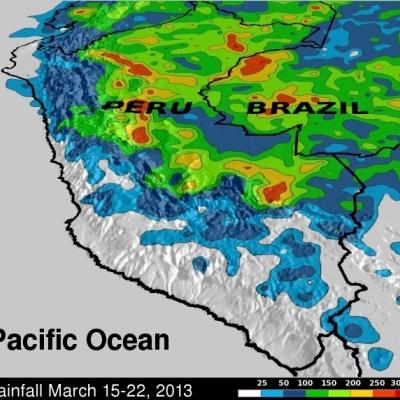
Hundreds of people in central Peru were recently flooded out of their homes. Rivers left their banks washing away buildings and highways while areas of Peru along the coast of the Pacific Ocean were relatively dry. Flooding from heavy rainfall in some areas of Peru was occurring at the end of the normal rainy season. Data from the TRMM satellite are used to calibrate rainfall data merged from various satellite sources. TRMM-based, near-real time Multi-satellite Precipitation Analyses (TMPA) at the NASA Goddard Space Flight Center are used to monitor rainfall over the global Tropics. TMPA

Tropical Cyclone Sandra Nearing New Caledonia

Tropical cyclone Sandra formed in the Coral Sea south off the Solomon Islands on March 7, 2013. Sandra intensified over the open waters of the Coral Sea and became a very powerful tropical cyclone with winds of about 110 kts (~127 mph). Sandra has started weakening but is predicted to buffet northern New Caledonia with tropical storm force winds on March 12, 2013. Sandra's approximate past and forecast locations are shown overlaid in white. The TRMM satellite passed above Sandra on March 10, 2013 at 2219 UTC. A rainfall analysis using data captured by TRMM's Microwave Imager (TMI) instrument

Tropical Cyclone Sandra Brushing New Caledonia

On March 11, 2013 the TRMM satellite twice flew above weakening tropical cyclone Sandra as it was passing to the west of New Caledonia in the southern Pacific Ocean. TRMM's Precipitation Radar (PR) had a very good view of Sandra as it passed directly above the tropical cyclone on March 11, 2013 at 1312 UTC. TRMM PR measured rainfall at the extreme rate of over 206 mm/hr (~8 inches) in an area southwest of Sandra's eye. Those TRMM PR data also showed that very little rain was occurring north of the weakening tropical cyclone's eye. Click here to see a simulated Flyby over Sandra using 3-D TRMM

Tropical Cyclone Rusty's Flooding Rainfall

In addition to high winds tropical cyclone Rusty's heavy rainfall caused flooding in north-western Australia. The TRMM satellite's main purpose is the accurate measurement of tropical rainfall around the globe. TRMM is also used to calibrate rainfall estimates from other satellites. The TRMM-based, near-real time Multi-satellite Precipitation Analysis (TMPA) at the NASA Goddard Space Flight Center provides estimates of rainfall over the global Tropics. TMPA rainfall totals in association with tropical cyclone Rusty are shown for the period from February 21-28, 2013. Rusty's approximate 0000Z

Tropical Cyclone Rusty Moves Into Australia

On February 27, 2013 at 0559 UTC The TRMM satellite again saw tropical cyclone Rusty moving toward Australia's coastline north-west of Hedland. A rainfall analysis derived from TRMM's Microwave Imager (TMI) data is shown overlaid on a visible/infrared image from the TRMM Visible and InfraRed Scanner (VIRS). Rusty's eye, surrounded by light to moderate rainfall, was revealed by TRMM's TMI data to be located very near the coastline. Click here to see an animation which fades from the underlying visible/infrared image to the TMI rainfall analysis image. Tropical cyclone Rusty is predicted to

Tropical Cyclone Batters and Drenches Samoan Islands

The TRMM satellite had an excellent view of tropical cyclone Evan on December 12, 2012 at 1704 UTC when it was battering the Samoan Islands with hurricane force winds. Evan is predicted by the Joint Typhoon Warning Center (JTWC) to intensify and have winds of 130kts (~150 mph) while remaining close to the islands. This wind speed would make it a strong Category 3 storm on the Saffir-Simpson Scale. A storm surge of 4.5 meters (14 feet) was reported along the Samoan coast. Evan's rainfall was analyzed using TRMM's Microwave Imager (TMI) and Precipitation Radar (PR) data. This analysis shows that

Category 3 Tropical Cyclone Evan

Intensifying tropical cyclone Evan devastated the Samoan Islands when it passed over the islands on December 13, 2012. The TRMM satellite flew directly above Evan today (December 14, 2012) at 0659 UTC when the tropical cyclone was a category 3 on the Saffir-Simpson scale with winds of 100kts (115 mph). TRMM's Microwave Imager (TMI) and Precipitation Radar (PR) data were used in the rainfall analysis on the first image. TRMM's Precipitation Radar (PR) showed that very intense storms in Evan's eye wall were dropping rain at a rate of up to 147mm/hr (~5.8 inches). The strongest radar reflectivity

Freda Brings Heavy Rains to New Caledonia

After forming just south of the Solomon Islands on the evening of December 28th (local time), Cyclone Freda moved southward and intensified, becoming a strong Category 3 cyclone on the 30th. As the storm continued to move south, it weakened significantly and approached the island of New Caledonia on the 2nd of January 2013 as a tropical storm. TRMM captured this image of Freda at 07:16 UTC (6:16 pm local time) 2 January 2013. The image shows an instantaneous snap shot of the rain intensities within Freda. Rain intensities in the center of the swath are from the TRMM Precipitation Radar (PR)

Extreme Rainfall Causes Flooding Over Eastern Australia

A large area of low pressure from the remnants of tropical storm Oswald has caused additional extremely heavy rainfall as it moved southward over eastern Australia. This deluge has caused flooding in areas from the Cape York Peninsula to the Queensland state capital, Brisbane. At least four deaths have been attributed to the high winds and flooding associated with this low pressure system. This image shows a TRMM calibrated Multi-satellite Precipitation Analysis (MPA) for the period from January 21-28, 2013. This analysis shows that tropical cyclone Oswald dumped over 600mm (~23.6 inches) of

Early Spring-like Storm Brings Severe Weather, Tornadoes to the Southeast

Despite it only being the end of January, a large spring-like storm system recently swept through the central and eastern part of the country, bringing a surge of warm air northward over the eastern third of the country and a threat for severe weather over much of the southeast as a strong jet stream dove down out of the Rockies southward to the northern Gulf Coast before racing northward again on the western side of the Appalachians. TRMM captured this image of a long line of strong storms associated with an advancing cold front stretching from southwest Alabama up through the central part of