TRMM News

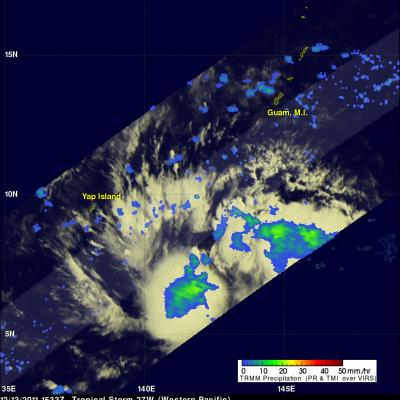
Tropical Storm Washi (27W) Strengthens

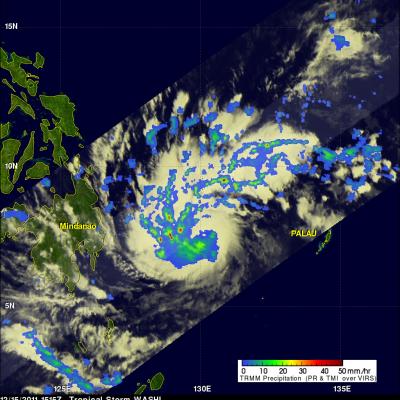
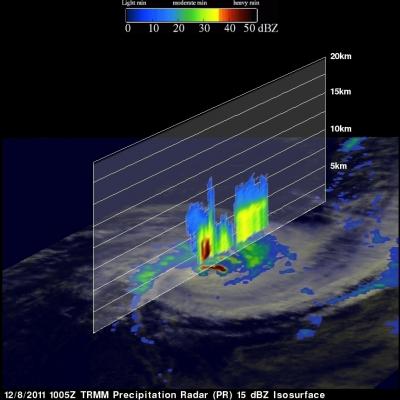
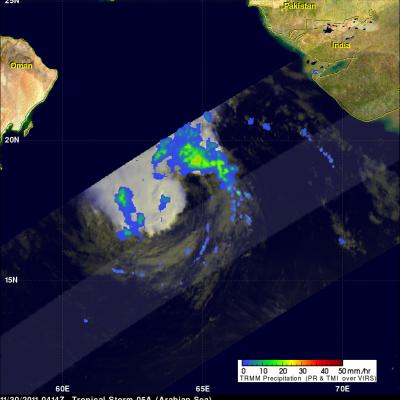
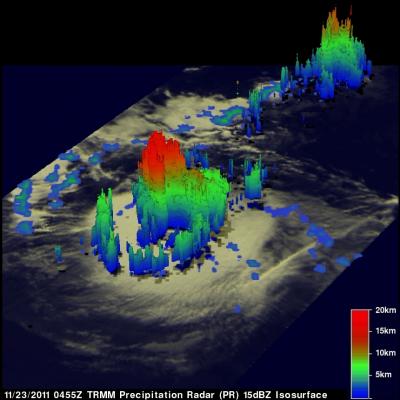
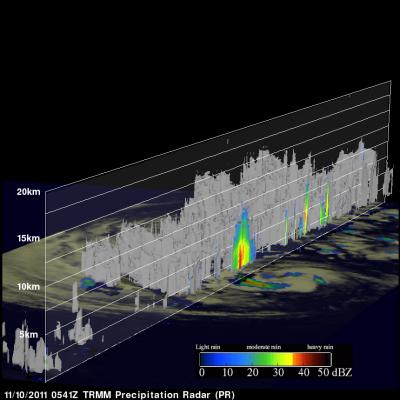
As expected tropical storm Washi (27W) had strengthened when the TRMM satellite passed over on 15 December 2011 at 1515 UTC collecting data used in the rainfall analysis shown above. TRMM Microwave Imager (TMI) and Precipitation Radar (PR) data are shown overlaid on an enhanced infrared image from the satellite's Visible and InfraRed Scanner (VIRS). This rainfall analysis shows that Washi was much better organized with very heavy rainfall of over 50mm/hr (~2 inches) revealed by TRMM PR within bands spiraling into the center of the storm. The 3-D image above used Precipitation Radar data from

Tropical Storm 27W Forming

Tropical Cyclones can form in the western Pacific Ocean at any time during the year but they occur most frequently during the months of June through November so tropical storm 27W is a little unusual. The TRMM satellite saw what was then tropical depression 27W on 13 December 2011 at 1533 UTC. It was upgraded to a Tropical storm by the Joint Typhoon Warning Center (JTWC) the next day at 0900 UTC. TRMM's Microwave Imager (TMI) shows that moderate rainfall was located in clusters of strong convective storms within the developing tropical cyclone. Tropical storm 27W has been predicted to

TRMM Sees Powerful Tropical Cyclone Alenga

Tropical Cyclone Alenga's wind speeds increased to a maximum of about 90kts (~104 mph). Alenga had weakened from this maximum intensity when the TRMM satellite passed directly above in the early evening of 8 December 2011 at 1005 UTC. A precipitation analysis from TRMM's Microwave Imager (TMI) and Precipitation Radar (PR) are shown above overlaid on a Visible/Infrared image from Visible and InfraRed Scanner (VIRS) data. This analysis shows that very heavy rainfall of over 50 mm/hr (~2 inches) was being produced by intense storms in Alenga's eye wall. The image below shows a 3-D vertical slice

Tropical Storm Alenga Intensifies

The TRMM satellite again passed over intensifying tropical storm Alenga in the South Indian Ocean on 5 December 2011 at 2103 UTC. As expected Alenga had become better organized with TRMM's Precipitation Radar (PR) seeing scattered bands of heavy rainfall spiraling into the center of the storm. Alenga is expected to move south-eastward over the open waters of the South Indian Ocean and reach minimal hurricane force on 7 December 2011. A 3-D image using TRMM PR is shown above. Very powerful storms are shown reaching heights of about 16 km (~9.9 miles). TRMM PR found a reflectivity value of 53.67

TRMM Sees First Tropical Storm Forming In The South Indian Ocean

On 4 December 2011 at 1210 UTC The TRMM satellite had a look at the first tropical storm forming in the Indian Ocean this season. Tropical cyclones normally form in this area between 15 November and 30 April so this one was a little overdue. The "top down" view above shows a rainfall analysis from TRMM Microwave Imager (TMI) and Precipitation Radar (PR) overlaid on an enhanced infrared image from Visible and InfraRed Scanner (VIRS) data. This analysis shows that very heavy rainfall of over 50 mm/hr (~2 inches) was occurring in the forming tropical cyclone near the center of it's circulation

Tropical Storm in the Arabian Sea

Tropical Storm 05A, the 5th of the season in the North Indian Ocean, has been steadily making it's way northwestward across the Arabian Sea over the past few days but is now expected to weaken, reducing the threat to Oman, southern Iran and Pakistan. The storm formed back on November 26th in the North Indian Ocean about 170 km (~105 miles) west of the southern tip of India and has maintained the same minimal tropical storm intensity with sustained winds of around 35 knots (~40 mph) while moving steadily to the northwest into the central Arabian Sea. The Tropical Rainfall Measuring Mission

TRMM Sees Weakening Hurricane Kenneth

Hurricane Kenneth (in the eastern Pacific Ocean) reached powerful category four hurricane strength with wind speeds of 125 kts (~144 mph) on Tuesday 22 November 2011. The TRMM satellite passed directly above Kenneth as it was rapidly weakening on Wednesday 23 November 2011 at 0455 UTC. A rainfall analysis from TRMM's Micrwave Imager (TMI) and Precipitation Radar (PR) instruments is shown overlaid on an infrared image from TRMM's Visible and InfraRed Scanner (VIRS). Very heavy rainfall of over 50mm/hr (~2 inches) is shown by this analysis occurring in the northeastern side of Kenneth's eye wall

Tropical Storm Kenneth

The TRMM satellite had a good view of tropical storm Kenneth in the eastern Pacific Ocean when it passed above on 21 November 2011 at 0510 UTC (20 November 2011 9:10 PM PST). The National Hurricane Center (NHC) upgraded Kenneth to a hurricane on 21 November 2011 at 1500 UTC (7:00 AM PST) after determining that a ragged eye was forming. The image on the right shows a rainfall analysis derived from TRMM's Microwave Imager (TMI) and Precipitation Radar (PR) instruments. TMI data show that heavy rainfall was occurring around the center of Kenneth's circulation.

TRMM Sees Deadly Tornadic Thunderstorms

Tornadoes are expected to accompany severe storms in the springtime in the U.S., but this time of year they also usually happen. When a line of severe thunderstorms associated with a cold front swept through the U.S. southeast on Nov. 16, TRMM collected rainfall data on the dangerous storms from space. TRMM's Precipitation Radar (PR) data was used to show the line of severe thunderstorms in 3-D. The line of storms were pushing through North and South Carolina on Nov. 16, 2011. Strong updrafts had pushed precipitation within some of these storms to heights of 15km (9.3 miles). Credit: SSAI/NASA

TRMM PR Slices Through Sean

The TRMM satellite had a good look at tropical storm Sean when it flew over on 10 November 2011 at 0541 UTC (00:41 AM EST). TRMM's Precipitation Radar (PR) data were used in the image above to show a 3-D cross section through Sean. TRMM's PR revealed that heights of storms in the edge of Sean's center of circulation were reaching to about 11km (~6.8 miles). Radar Reflectivity values of up to 46.0 dBZ found in these storms also showed that rainfall was heavy in that area. The "top down" satellite view above shows that those storms in Sean's northwestern quadrant were the most powerful. The rest