MA-ON

Tropical Depression MA-ON Evaluated With GPM Data

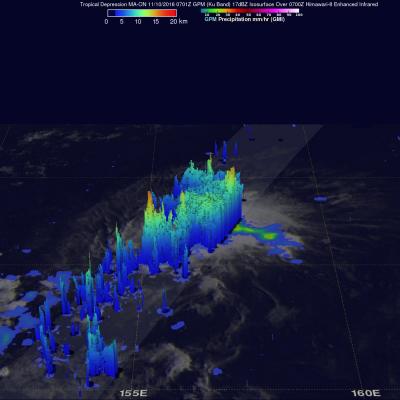
Tropical cyclones have been forming frequently in the Western Pacific Ocean since July 2016. 36 named tropical cyclones have formed in the Western Pacific in less than 5 months with 14 of them becoming typhoons. Tropical Depression MA-ON Formed on November 10, 2016 northeast of Guam. MA-ON had maximum sustained winds estimated at 30 kts (34.5 mph) when the GPM core observatory satellite flew over on November 10, 2016 at 0701Z. GPM's Microwave Imager (GMI) and Dual-Frequency Precipitation Radar (DPR) instruments showed that the tropical depression contained some very heavy showers. Strong bands

Typhoon Brings Heavy Rain to Southern Japan

Typhoon Ma-On formed from an area of disturbed weather in the northwest Pacific halfway between Wake Island and the Northern Marianas on the 11th of July 2011. The system slowly developed and became a typhoon two days later on the 13th as it continued tracking westward. Ma-On then reached its maximum intensity on the 15th with sustained winds estimated at 115 knots (~132 mph), making it a Category 4 typhoon, before turning northward towards southern Japan. Ma-On began to weaken as it neared the southeast coast of Japan where it briefly made landfall in southern Tokushima Prefecture on the

MA-ON Weakens

Typhoon MA-ON had weakened to a strong tropical storm with wind speeds of about 60 kts (69 mph) when the TRMM satellite again flew over on 19 July 2011 at 2348 UTC. The rainfall analysis above using TRMM's Microwave Imager (TMI) and Precipitation Radar (PR) data was overlaid on a daylight visible/infrared image from TRMM's Visible and InfraRed Scanner (VIRS) instrument. It reveals that although weaker MA-ON was dropping heavy rainfall over southern areas of the Japanese Island of Honshu. A red tropical storm symbol shows the location of MA-ON's center of circulation at that time. Click here to

TRMM Shows Typhoon Drenching Southern Japan

The TRMM satellite saw typhoon MA-ON on 18 July 2011 at 2306 UTC and again on 19 July 2011 at 0221 UTC. The rainfall analysis above used TRMM's Microwave Imager (TMI) and Precipitation Radar (PR) data from both orbits. It shows that bands of very heavy rainfall of over over 50 mm (~2 inches) were falling over both of the Japanese island of Shikoku and Honshu. At the time of the later TRMM orbit MA-ON's winds had weakened to about 67 kts (~77 mph) making it a category 1 typhoon on the Saffir/Simpson scale. MA-ON is expected to move toward the east-southeast and weaken as it continues to affect

Typhoon MA-ON Threatening Japan

Typhoon MA-ON was a category 2 typhoon on the Saffir/Simpson scale with wind speeds of about 85 kts (~98 mph) when the TRMM satellite captured those data shown above on 18 July 2011 at 0316 UTC. MA-ON had weakened considerably from a very powerful category four typhoon with wind speeds of 115 kts (~132 mph) on 15 July 2011. TRMM's Microwave Imager (TMI) and Precipitation Radar (PR) data were used to produce the rainfall analysis shown above. This TRMM analysis shows that MA-ON still contained organized bands of very intense rainfall with the most intense precipitation located in the eastern

TRMM Sees Powerful Typhoon MA-ON

The TRMM satellite passed almost directly above powerful typhoon MA-ON on 14 July 2011 at 0525 UTC. This TRMM orbit revealed that MA-ON was extremely well organized with several bands of intense thunderstorms around a well defined eye. This rainfall analysis, using data from TRMM's Microwave Imager (TMI) and Precipitation Radar (PR), shows that the heaviest rainfall of over 50 mm/hr (~ 2 inches) was located in the southwestern quadrant of MA-ON's eye wall. MA-ON is predicted to become an even more dangerous super typhoon with wind speeds of 135 kts (155 mph) on 17 July 2011 while approaching