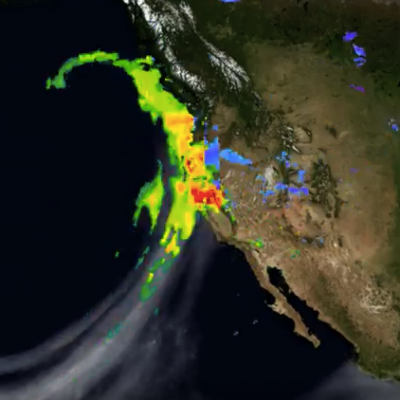
After more than four years of drought, Californians may wonder where the current rain is coming from. Using satellites, NASA scientists have a unique view of the sources of precipitation, and how it reaches the western United States.
After more than four years of drought, Californians may wonder where the current rain is coming from. Using satellites, NASA scientists have a unique view of the sources of precipitation, and how it reaches the western United States. Rain is often carried by narrow tendrils of moisture called atmospheric rivers that occur all over the world, shown here in white. The atmospheric rivers that affect the western United States are known as the Pineapple Express because they transport water vapor from as far south as Hawaii to California. When the moisture reaches land, it is forced up over the...
We have discovered that the gauge analysis was erroneously omitted from the "production" 3B42/43 products starting with January 2016 due to issues with handling a change of data format. Thus, the production 3B42/43 are being re-computed. This does not affect the TMPA-RT suite of products, since no month-to-month gauge data are used. Note this issue also affects the current Version 3 IMERG Final Run products for January 2016. They are being recomputed as well. The current Version 3 IMERG Early and Late Runs are not affected. An update will be provided here when the corrected products are ready.
UPDATE 9/27/16: January 2016 IMERG has been regenerated and posted. This was necessary due to an error that omitted the gauge analysis in the Final products. Also, 3B42/3B43 have been recomputed and posted. Let me know if you have any further questions. --- PPS has removed the January 2016 GPM IMERG and January through June 2016 3B42/3B43 TMPA products from our ftp archive: ftp://arthurhou.pps.eosdis.nasa.gov/ and STORM: https://storm.pps.eosdis.nasa.gov/storm/ The GPM science team discovered that the IMERG final products for Jan 2016 and the Jan-Jun 2016 TMPA 3B42/3B43 products for which we
What: Google Earth access for near-realtime IMERG and 3B42 KML files will be replaced by an updated service for viewing precipitation data in near-real time on a 3D virtual globe using Cesium ( https://cesiumjs.org/). When: The current plan is to make the cut-over to the new Cesium-based service on or about October 16, 2016. Why: The evolution of network policies and applications prevents continued GPM use of Google Earth. Note: If you wish to continue using KML files with a non-Google Earth client, please contact the Precipitation Measurement Missions at: https://pmm.nasa.gov/contact
The PPS (Precipitation Processing System) will be down today, September 20,2016 from 8:00am -2:00pm EDT (12:00 - 18:00 UTC). for scheduled maintenance. During this time all data transfers between PPS source and its consumer systems (GDAAC/DISC) as well as Science User services (FTP and STORM access) will be unavailable. You may contact PPS Operations at 301-614-5247 , 301-614-5184 or fax us at 301-614-5269 if there are any urgent matters requiring our immediate attention during this period. You will be informed when PPS systems become available. We apologize for any inconvenience this may
FNMOC is behind in providing the SSMIS data used in IMERG. Therefore, the Early and possibly Late IMERG products will contain less satellite estimates and be of somewhat lesser quality. FNMOC stopped providing data around 00 UTC today (8 September 2016), meaning there has been no data available from the three operational SSMIS sensors to the TMPA-RT datasets. As a result, more lower-quality IR-based estimates are being used. In addition, if there are dropouts in the IR data, there is a higher probability that gaps will appear in the combined product, 3B42RT. We will update the situation when
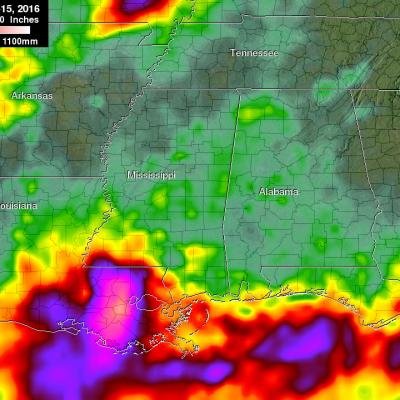
An extremely severe rainfall event hit the states of Louisiana and southern Mississippi when a very slow moving low pressure system continuously pulled tropical moisture from the Gulf Of Mexico. Measurements by the GPM core observatory satellite showed that rainfall intensity within the low pressure system actually increased on August 12, 2016 as the low settled over southeastern Louisiana. At least 4 people have died in record flooding after the unusually heavy rainfall starting falling last week. More than 27 inches (686 mm) of rain have been reported in the area. This is the second time
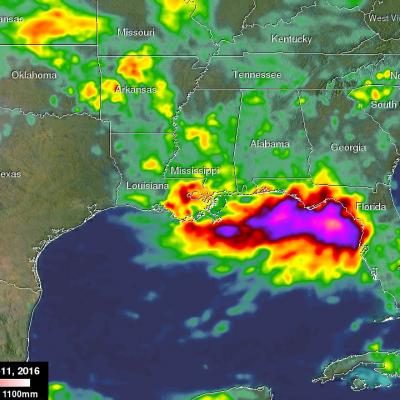
For the better part of a week, a persistent, mid-level area of low pressure has been tapping into warm, moist air to produce stormy weather in the northeastern Gulf Of Mexico. The National Hurricane Center (NHC) monitored this stormy area for possible development but unfavorable upper-level winds and the close proximity to land prevented development into a tropical system. However, during the past week from as much as 4 to over 15 inches (254-381 mm) of rain fell along the Gulf Coast from Tampa northward through the Big Bend to as far west as central Louisiana. So far the highest rainfall
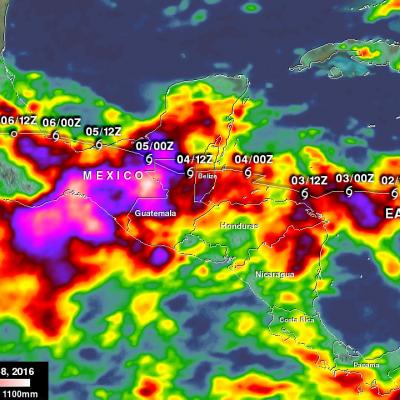
Hurricane Earl began as a tropical wave that was tracked by the National Hurricane Surface (NHC) from the African Coast to the Caribbean Sea. The tropical wave drenched the Dominican Republic where it was blamed for the deaths of six people. Southwest of Jamaica on August 2, 2016 the tropical wave developed a closed circulation and Earl was upgraded to a tropical storm. On Wednesday August 3, 2016 Earl became a hurricane when it was located about 150 miles east of Belize. On Thursday Earl made landfall just southwest of Belize City, Belize at about 0600 UTC (2 AM EDT). At landfall Earl had