tropical cyclones

TRMM Satellite Shows Possible Storm Development

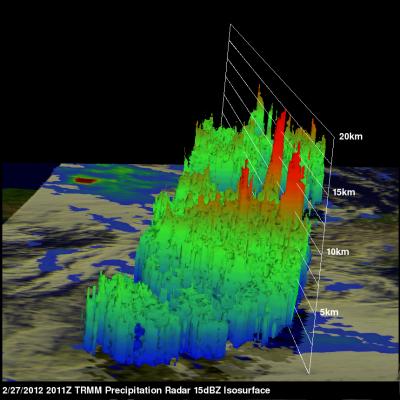
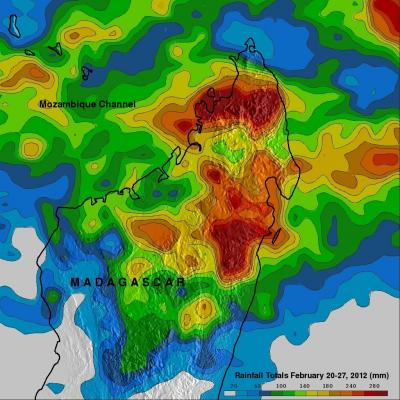
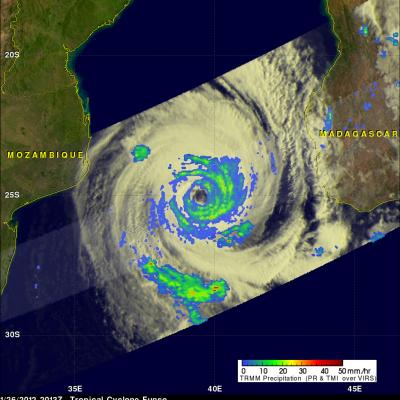
The TRMM satellite had another revealing pass over the Mozambique Channel and Madagascar on 27 February 2012 at 2011 UTC. This area is being monitored for significant tropical cyclone development. TRMM's Microwave Imager (TMI) and Precipitation Radar (PR) data were used in the rainfall analysis on the upper left. This analysis shows that very intense storms were being produced by a cyclonic circulation off northwestern Mozambique. These storms were dropping rainfall at a rate of over 50mm/hr (~2 inches) in the Mozambique Channel between Mozambique and Madagascar. The 3-D TRMM PR image on the

More Flooding Rainfall In Madagascar

A weak tropical cyclone locally called Irina caused flooding over northern Madagascar less than two weeks after deadly flooding by Tropical Cyclone Giovanna . The lastest tropical cyclone didn't have very strong winds when it passed over the coastal city of Vohemar on Madagascar's northeastern coast but street flooding was reported. The rainfall analysis above was made at the Goddard Space Flight Center using data from a near-real time Multi-satellite Precipitation Analysis (TMPA). TRMM-based near-real time Multi-satellite Precipitation Analysis (TMPA) data are used to monitor rainfall over

Deadly Tropical Cyclone Giovanna Floods Madagascar

The rainfall analysis above uses near-real-time, TRMM-based precipitation estimates (3B42)from a merger of all available satellite data. This Multi-satellite Precipitation Analysis (TMPA) done at the NASA Goddard Space Flight Center provides estimates of rainfall over the global Tropics. This rainfall analysis shows the rainfall from February 8-15, 2012 that was mainly caused by tropical cyclone Giovanna when it passed over Madagascar. This analysis indicates that the highest rainfall totals of over 250mm (~10 inches) fell in the coastal area east of Madagascar's capitol of Antananarivo. In

TRMM Sees Powerful Giovanna Menacing Madagascar

The TRMM Satellite had a fairly good early morning view of powerful tropical cyclone Giovanna approaching Madagascar on 13 February 2012 at 0333 UTC. Rainfall from TRMM Microwave Imager (TMI) data is shown overlaid on a visible/infrared image from TRMM's Visible and InfraRed Scanner (VIRS) instrument. Giovanna was an intensifying category 4 tropical cyclone with with wind speeds estimated at over 125 kts (~144 mph) and is predicted by the JTWC to become slightly more powerful before hitting Madagascar.

Giovanna Shown Becoming Dangerous

Tropical cyclone Giovanna was located in the Indian Ocean east-northeast of Madagascar when it was classified as a tropical storm on 9 Febuary 2012. The TRMM satellite image above shows Giovanna when it was rapidly becoming more powerful on 11 February 2012 at 1200 UTC. Giovanna had intensified to a category 3 tropical cyclone on the Saffir-Simpson scale with wind speeds estimated at 100 kts (~115 mph). This TRMM pass shows that an eyewall replacement was occurring at that time. A small ring of strong convective storms was located around the center of the center eye and other powerful storms

TRMM Views Tropical Cyclone Jasmine

The TRMM satellite traveled directly above tropical cyclone Jasmine in the south Pacific Ocean on 8 February 2012 at 2156 UTC. Jasmine was classified as a powerful category 4 on the Saffir Simpson Scale with wind speeds of 115 kts (~132 mph) at it's peak intensity but had started to weaken at the time of this pass. Rainfall from TRMM's Microwave Imager (TMI) and Precipitation Radar (PR) instruments showed that intense storms in bands around Jasmine's large circular eye were dropping rainfall at a rate of over 50mm/hr (~2 inches). This was a daytime pass so the rainfall analysis was overlaid on

Tropical Cyclone 12S Developing

The TRMM satellite passed above a developing tropical cyclone in the South Indian Ocean designated as 12S on 9 February 2012 at 0402UTC. A rainfall analysis derived from TRMM's Microwave Imager (TMI) and Precipitation Radar (PR) is shown overlaid on a visible/infrared image from TRMM's Visible and InfraRed Scanner (VIRS) instrument. This TRMM view shows that the storm was already well organized. TRMM's PR shows that heavy rainfall of over 50 mm/hr (~2 inches) was occuring in storms near center of the circulation. Some of the powerful storms dropping this rainfall were shown by TRMM to reach

Iggy Rainfall Hits Australia

On 2 February 2012 at 1044 UTC the TRMM satellite again saw weakening tropical storm IGGY as it was approaching the coast of southwestern Australia. Data from TRMM's Microwave Imager (TMI) and Precipitation Radar (PR) instruments showed that bands of heavy rainfall measuring over 50mm/hr (~2 inches) were hitting coastal areas northwest of Perth, Australia. A red tropical storm symbol shows where Iggy's center was located.

Tropical Cyclone Iggy

The TRMM satellite passed above tropical storm Iggy on 1 February 2012 at 0647 UTC as the storm was heading toward the coast of southwestern Australia. Iggy was briefly categorized as a category 1 tropical cyclone on the Saffir-Simpson scale but is predicted to be a weak tropical storm with winds of about 35kts (~40 mph) when it moves over the Australian coast. Iggy's past and forecast locations are shown with appropriate white tropical cyclone symbols on the image above. TRMM data revealed that Iggy had a large area of moderate to heavy rainfall south of the center of circulation. TRMM's

Tropical Cyclone Funso

The TRMM satellite saw directly into the eye of tropical Cyclone Funso on 26 January 2012 at 2013 UTC. TRMM Microwave Imager (TMI) and Precipitation Radar (PR) rainfall shows that frequent moderate to heavy rainfall was located in bands around Funso. TRMM PR data show that the tallest storm towers , reaching to about 12km (~7.5 miles), were located in a feeder band southwest of the eye.