tropical storms

Tropical Storm Toraji Adds To Japan's Rainfall

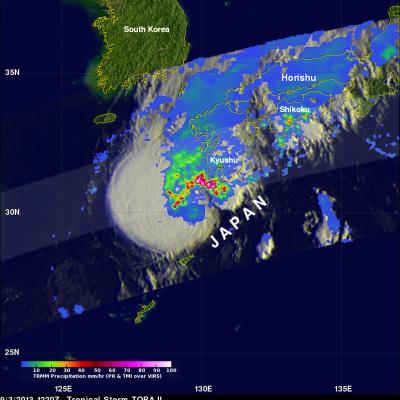
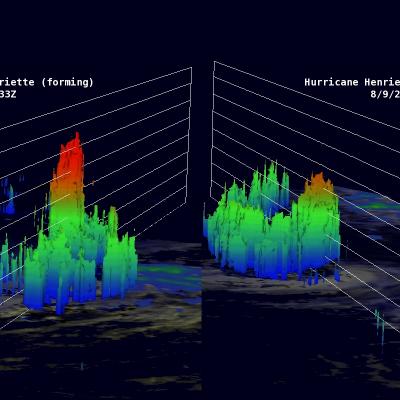
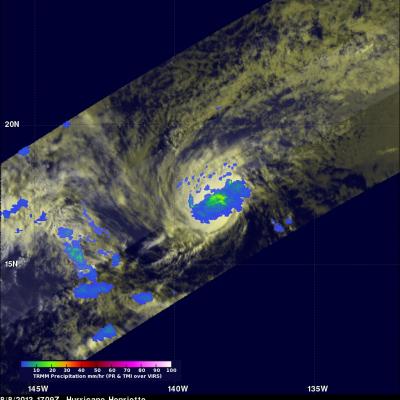
Tropical storm Toraji quickly followed tropical storm Kong-rey and has started to again saturate Japan with flooding rainfall. The TRMM satellite flew over Toraji on September 3, 2013 at 1220 UTC. Rainfall estimates using data collected by TRMM's Microwave Imager (TMI) and Precipitation Radar (PR) instruments with this orbit are displayed in the left image. TRMM PR measured rain falling at a rate of 133 mm/hr (~5.2 inches) in an area just north of Toraji's center of circulation. The image on the right shows a 3-D view from the south of this area using TRMM PR data.

TRMM Sees Heavy Rain Over Taiwan

The TRMM satellite flew directly above western Taiwan on August 28, 2013 at 2108 UTC when tropical storm Kong-Rey was dropping enormous amounts of rain. Flooding from torrential rainfall with totals of over 500mm (~19.7 inches) have been reported in western Taiwan. This rainfall analysis from TRMM's Microwave Imager (TMI) and Precipitation Radar (PR) instruments revealed that precipitation was falling at a rate of over 205mm/hr (~8 inches) in intense bands of rain over southwestern Taiwan. Tropical storm Kong-Rey's location when TRMM flew over is shown with a red symbol. This TRMM orbit also

Tropical Storm Kong-Rey To Hit Taiwan Then Japan

Tropical storm Kong-Rey formed in the western Pacific Ocean east of the Philippines on August 26, 2013. Kong-rey passed to the northeast of the Philippines and is predicted to cross over northeastern Taiwan tomorrow. In about three days it is then predicted to be the first tropical cyclone of 2013 to hit southern Japan. The TRMM satellite had an early morning view of tropical storm Kong-Rey on August 27, 2013 at 2203 UTC (~6:03 AM local time). A precipitation analysis from TRMM's Microwave Imager (TMI) and Precipitation Radar (PR) instruments is shown on the left above overlaid on an enhanced

Tropical Storm Fernand Causes Deadly Mudslides

Heavy rain with tropical storm Fernand generated mudslides that caused the reported deaths of 13 people in the Mexican state of Veracruz. TRMM precipitation data are used to calibrate rainfall estimates from other satellites. The resulting TRMM- based, near-real time Multi-satellite Precipitation Analysis (TMPA) at the NASA Goddard Space Flight Center is used to estimate rainfall over a wide portion of the globe. The analysis above shows estimated TMPA rainfall totals for the period from August 20-27, 2013 when Fernand was developing and moving through the area. Total Rainfall greater than

Tropical Storm Fernand Over Eastern Mexico

Tropical storm Fernand was drenching the state of Veracruz on Mexico's Gulf Of Mexico coast when the TRMM satellite flew over on August 26, 2012 at 0534 UTC. A rainfall analysis from TRMM's Microwave Imager (TMI) and Precipitation Radar (PR) instruments is shown overlaid on an enhanced infrared image from TRMM's Visible and InfraRed Scanner (VIRS). TRMM PR found rain falling at a rate of over 118mm/hr (~4.6 inches) in rain bands north of Fernand's center of circulation. TRMM PR data revealed that Fernand had a fairly well defined center. TRMM's Precipitation Radar (PR) data were used in the

TRMM Sees Weakening Henriette

As predicted by the National Hurricane Center (NHC), hurricane Henriette has started a weakening trend. The TRMM satellite flew over Henriette again on August 9, 2013 at 0122 UTC (~ 4 PM local time). The image above shows a comparison between this latest orbit and another visible image from TRMM's previous orbit on August 8, 2013 at 1709 UTC. The eye that was apparent in the previous image was no longer distinct in the latest TRMM pass. The image of the right shows that rain was still falling at a rate of over 161mm/hr (~6.3 inches) near the center of the hurricane. The image above shows a

Hurricane Henriette Still Strong

The TRMM satellite saw hurricane Henriette again on August 8, 2013 at 1709UTC (~8:09 AM Local Time). Henriette is predicted to start weakening tomorrow but with this TRMM pass the hurricane's eye could still be easily found on the TRMM visible (VIRS) image on the left. Henriette was small but TRMM's Microwave Imager (TMI) and Precipitation Radar (PR) showed that moderate to heavy rainfall was occurring in an area around the center of the hurricane.

Hawaii Says Aloha To Flossie

The TRMM satellite had an excellent day time view of dissipating tropical depression Flossie as it was moving to the northwest of the Hawaiian Islands on July 30, 2013 at 2348 UTC (1:38 PM HAST). An analysis of rainfall from TRMM's Microwave Imager (TMI) and Precipitation Radar (PR) is shown overlaid on a combination visible and infrared image from TRMM's Visible and InfraRed Scanner (VIRS) instrument. This analysis shows that very little precipitation was then occurring near the center of the weakening tropical cyclone's circulation. The most intense rain was found by TRMM to be falling at a

Weakening Tropical Storm Flossie Hits Hawaiian Islands

Weakening tropical storm Flossie had lightning with heavy rain and winds as it drove through the Hawaiian islands. The TRMM satellite flew above tropical depression Flossie on July 30, 2013 at 0717 UTC (July 29, 2013 at 9:17 PM HAST). TRMM's Microwave Imager (TMI) and Precipitation Radar (PR) instruments showed that the heaviest rain at that time was located to the southwest of the Islands and was falling at a rate of over 88mm/hr (3.5 inches). Flossie's approximate locations with appropriate tropical cyclone symbols are shown overlaid in white. TRMM's Precipitation Radar is able to separate

Tropical Storm Flossie Threatens Hawaiian Islands

The TRMM satellite had a very good view of tropical storm Flossie in the eastern Pacific Ocean on July 28, 2013 at 0734 UTC. The image on the left shows an analysis of rainfall data from that pass using TRMM's Microwave Imager (TMI) and Precipitation Radar (PR) instruments. TRMM PR data found rain falling at a rate of over 46 mm/hr (~1.8 inches) in storms just south of Flossie's center of circulation. TRMM PR also found that some of these storms were returning 45dBZ reflectivity values to the satellite indicating that moderate to heavy rain was falling in that area. The map on the right shows